Click here to learn more

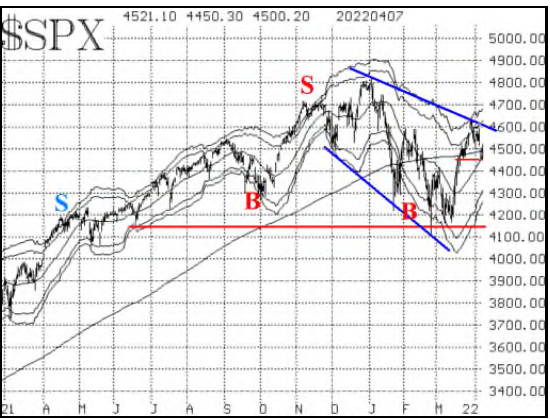
• A move above 4637 (last week’s highs) would justify a bullish stance, while a move below 4420 would justify a bearish stance. Beyond those levels, there is further resistance in the area of the all-time highs, at 4700-4800.
• On the downside, there is strong support near where the market probed in late February and early March: the 4100-4200 level.
Put-Call Ratio Analysis

• Our most bullish indicators remain the equity-only put-call ratios, which are still on strong buy signals. They peaked from extremely high (oversold) levels in mid-March and are in the process of declining rapidly now. The slight wiggle on the standard chart (Figure 2) is meaningless, according to our analysis programs; it remains on a buy signal
VIX Analysis

• There are mixed signals from the volatility indicators.
• A brand new $VIX “spike peak” buy signal was generated at the close on April 7th. It will remain in effect for 22 trading days, unless stopped out by $VIX moving above the highest price that it had reached at the recent peak (24.78). So that is a bullish sign.
• Contrasting that, though, is the fact that $VIX has once again moved above its 200-day moving average. That means that both $VIX and its 20-day MA are above the 200-day, and that is an intermediate-term sell signal. The last time this occurred was in mid-January (purple circle in Figure 4), and the stock market sold off from there.
• The construct of volatility derivatives remains bullish for stocks, as the $VIX futures are trading at a premium to $VIX, and the term structure slopes upward. The CBOE Volatility Index term structure also slopes upward.
Summary
• In a nutshell the SPX is somewhat range-bound, looking for a breakout above 4637 or a breakdown below 4420 as an area to add bullish or bearish positions, respectively.
• It is a short week for traders and investors as the market will be closed on the 15th in observance of Good Friday.
• Keep in mind that generally IV levels are lower during short weeks of trading.
• It seems like the bulk of quarterly earnings just ended and here we are again starting another round. Most earnings announcements will come later, but several • financial institutions are expected to announce later in the week.
• In addition, a few economic reports are due to be released, even on Friday. Have a great week and a Happy Easter, and enjoy some time off
Trade Ideas:
○ $VIX “Spike Peak” Buy Signal
§ As of the close of trading on April 7th, a new $VIX “spike peak” buy signal has been confirmed.
§ Buy 2 SPY May (6th) at the money calls And
§ Sell 2 SPY May (6th) calls with a striking price 15 points higher.
§ This buy signal will remain in effect for 22 trading days. Also, it would be stopped out if VIX subsequently closes above 24.78 – the highest peak price that generated the above sig
Earnings this week
—Wed 4/13 – JPM, Delta, BlackRock
–-Thu 4/14 – Wells Fargo Bank , Citi Bank , Morgan Stanly (MS) and Goldman Sachs (GS)

Economic Calendar
Apr 11: Consumer Price Index
Apr 11: Federal Budget
Apr 13: Producer Price Index
Apr 14: Jobless Claims
Apr 14: Retail Sales
Apr 14: Import Price Index
Apr 14: Business Inventories
Apr 15: Industrial Production
