4/8 Weekly Update – Earning season kicks off

4/8 Weekly Update – Earning season kicks off

Click here to learn more

SPX Chart Analysis

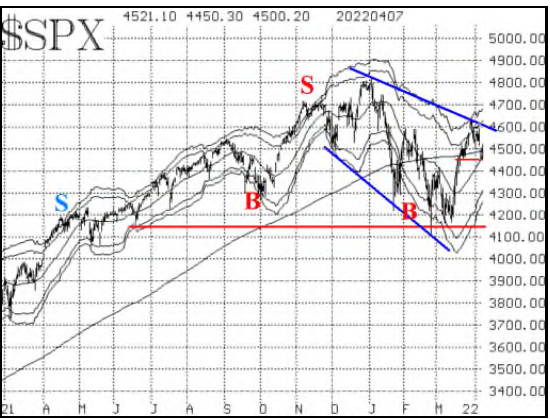
• A move above 4637 (last week’s highs) would justify a bullish stance, while a move below 4420 would justify a bearish stance. Beyond those levels, there is further resistance in the area of the all-time highs, at 4700-4800.
• On the downside, there is strong support near where the market probed in late February and early March: the 4100-4200 level.

Put-Call Ratio Analysis

• Our most bullish indicators remain the equity-only put-call ratios, which are still on strong buy signals. They peaked from extremely high (oversold) levels in mid-March and are in the process of declining rapidly now. The slight wiggle on the standard chart (Figure 2) is meaningless, according to our analysis programs; it remains on a buy signal

VIX Analysis


• There are mixed signals from the volatility indicators.
• A brand new $VIX “spike peak” buy signal was generated at the close on April 7th. It will remain in effect for 22 trading days, unless stopped out by $VIX moving above the highest price that it had reached at the recent peak (24.78). So that is a bullish sign.
• Contrasting that, though, is the fact that $VIX has once again moved above its 200-day moving average. That means that both $VIX and its 20-day MA are above the 200-day, and that is an intermediate-term sell signal. The last time this occurred was in mid-January (purple circle in Figure 4), and the stock market sold off from there.
• The construct of volatility derivatives remains bullish for stocks, as the $VIX futures are trading at a premium to $VIX, and the term structure slopes upward. The CBOE Volatility Index term structure also slopes upward.

Summary

• In a nutshell the SPX is somewhat range-bound, looking for a breakout above 4637 or a breakdown below 4420 as an area to add bullish or bearish positions, respectively.
• It is a short week for traders and investors as the market will be closed on the 15th in observance of Good Friday.
• Keep in mind that generally IV levels are lower during short weeks of trading.
• It seems like the bulk of quarterly earnings just ended and here we are again starting another round. Most earnings announcements will come later, but several • financial institutions are expected to announce later in the week.
• In addition, a few economic reports are due to be released, even on Friday. Have a great week and a Happy Easter, and enjoy some time off

Trade Ideas:
○ $VIX “Spike Peak” Buy Signal
§ As of the close of trading on April 7th, a new $VIX “spike peak” buy signal has been confirmed.
§ Buy 2 SPY May (6th) at the money calls And
§ Sell 2 SPY May (6th) calls with a striking price 15 points higher.
§ This buy signal will remain in effect for 22 trading days. Also, it would be stopped out if VIX subsequently closes above 24.78 – the highest peak price that generated the above sig

Earnings this week

Wed 4/13 – JPM, Delta, BlackRock
-Thu 4/14 – Wells Fargo Bank , Citi Bank , Morgan Stanly (MS) and Goldman Sachs (GS)

Economic Calendar

Apr 11: Consumer Price Index
Apr 11: Federal Budget
Apr 13: Producer Price Index
Apr 14: Jobless Claims
Apr 14: Retail Sales
Apr 14: Import Price Index
Apr 14: Business Inventories
Apr 15: Industrial Production

1/7/21 Trade Ideas

1/7/21 Trade Ideas

Symbol: MSFT   
Direction: Bullish Strategy: Bull Put Credit spread 
Strike Selection: Buy 280 / Sell 290 Put in Feb-18’22 ( Premium received $2.4 per contract ) 
Probability of Profit: 80% (89% P50)
Comments: IV Rank of 64% and -10% from its top is an attractive short premium setup.

Symbol: MSFT   
Direction: Bullish Strategy: Bull Call Debit Spread 
Strike Selection: March 18 expiry, 325 / 340 Bull Call spread
Probability of Profit: 50% ; Adjustment – Double down if the trade goes against you and then adjust with either diagonal or calendar spread ;  Comments: As QQQ almost dropped 6% from it high now its a good time to bottom-fish some high quality names like MSFT GOOGL AMZN ..


Symbol: XLF
Direction: Bullish Strategy: Long Call
Strike Selection: Buy +1 XLF 42 Call in Feb-18’22
Probability of Profit: 28%
Comments: UOA unusual option activity of massive buyer of 42 calls. Rising 10 year  yield interest rates and bonds falling is good for banks with fed tapering in 2022 . Adjustment – Double down if the trade goes against you and then adjust with either diagonal or calendar spread 

1/2/21 Update  – MSFT Profit posted 

1/3/21 – Trade Idea

1/3/21 – Trade Idea

TSLA – News Play –

TSLA in NEWS -> Tesla Reports 87% Increase in 2021 Deliveries

TSLA – Long Butterfly ( Cheap pre earning play based on strong positive news ) ; TSLA reports earnings on

AMZN – Earnings Play

AMZN have found support at 3330 – It have upside room to reach at around 3450 before earnings announcement on 2/1/2021

PYPL – Bullish
Long call – 220 Jan 21

Week of 9/13/2021

Week of 9/13/2021

Friday 9/10/2021 was a pretty bearish day for the markets in general. Every single index gapped up higher but sold off quickly into the afternoon to go out near the lows of the day. The SPX put together 5 red days which we have not seen since February. Seasonally, Sept is one of the worst for the markets based on history but with interest rates so low, buyers will likely continue to support this market. With the S&P 500 closing lower over the past five sessions, it shows that market pullback has started already. Implied volatility levels moved higher ( VIX > 20 ) closing at levels not seen in several weeks.

We can expect to see choppier price action this week without much in the way of news or earnings to provide some catalyst for moves. Don’t expect any big sell offs. In nutshell, this week outlook is chop with maybe a little more downside action.

 Economic calendar this week – 

• Sep 13: Federal Budget

• Sep 14: Consumer Price Index

• Sep 15: Import Price Index

• Sep 15: Industrial Production

 • Sep 16: Jobless Claims

Here are some trade ideas:

 SPX – With five consecutive closes lower, stocks may continue to fall. Call credit spreads with expiry Sep 24 looks good.

 AAPL – possible long if it breaks down to $142.5- $145 – AAPL has an event ( new iPhone 13 phone launch ) coming up on Tue 9/14/21. Buy the rumor and sell the news

 NVDA – The stock has been trading sideways for several sessions. Iron condors around potential support and resistance levels may be the way to go.

 DKNG – possible long on pullback to $60

 DOCU – possible long if gets to $270

 MRNA – trading range $375 to $450 (Strangle)