by Mahesh Kalbhor | Jan 30, 2022 | Weekly Update
The FED , the Federal Reserve, which looks ready to compound one
mistake with another. First calling inflation as transitory all last year in 2021 which helped bulls to pump the market into super bubble. Second mistake is to hike the rates too aggressively and put the economy into recession.
The Fed is behind the curve on inflation; the core personal-consumption-expenditure deflator rose 4.9% in December on an annualized basis, more than double the 2% inflation target. Now the Fed is ready to raise interest rates, probably in March, after assuming rising prices would be transitory.
The central bank’s statement on Wednesday Jan 26th 2011 contained few surprises, but then Fed Chairman Jerome Powell started talking. At first, he offered a fairly balanced outlook of the risks, with inflation on one side and the threat to growth from Omicron on the other, with the risks tilting a touch more toward the former than the latter.
But the more he spoke, the more hawkish he sounded. He didn’t dismiss the possibility of a half-point rate increase and suggested that the Fed could raise rates far more quickly than the four increases the market had priced in. By the end of the day, the Dow Jones Industrial Average had turned a 518-point gain into a 130-point drop, and investors were pricing in more than four rate hikes.
By Friday Jan 27th 2021 however, the overall averages conveyed little of that volatility. The Dow finished up 460.10 points, or 1.3%. The Nasdaq Composite ended the week little changed as blockbuster earnings from Apple (ticker: AAPL) and Microsoft (MSFT) helped it make back what had been a 4.9% loss. Only the Russell 2000, which officially entered a bear 🐻 market on Thursday, finished the week lower, by 1%.
Massive reversals were the norm, and the market went from simply oversold to “super oversold,” “When there’s this kind of selling intensity, there’s usually another short term drop and a quick dead ☠️ cat 🐈⬛ bounce before it falls apart into pieces.
But even when the market bounces-and it will bounce-investors have to know that the clock is counting down to recession and the end of the bull market. The clock, in this case, is the yield curve, and an inverted one is the one truly reliable recession signal. An inversion occurs when longer- term rates, which are typically higher than short-term ones, sink below their short-end counterparts. That’s not just a signal that a recession is coming-it also helps create the conditions for one by making lending unprofitable for banks, which borrow short and lend long.
Ultimately, the lack of credit causes a recession, though it usually takes months to occur.
The yield curve is flattening quickly. On Friday, the two-year Treasury yield closed at 1.17%, while the 10-year closed at 1.779%, putting the gap between them at 0.61 of a percentage point. On Dec. 31, that gap was 1.069 points. Since 1955, the yield curve has flattened about 0.8 of a point a year during the first year of a tightening cycle, which would mean the curve would invert sometime in the first half of 2023.
Recessions usually follow in eight to 19 months, which would put the next one in the middle of 2024. If the current market follows the historical path, the current upheaval, though painful, should simply mark a tantrum in risk markets that will pass.
But much will depend on how serious Powell is about raising rates to tackle inflation and the path of economic growth. Most analysts expects the Fed to lift rates aggressively, only to find that the economy is growing at a much slower pace than it thinks. He isn’t wrong about the economy, which looks set to slow during the first quarter of 2022, thanks, at least in part, to the Omicron variant of Covid-19.
The Fed is starting its rate increases too late. And the Fed will tighten the economy right into a recession.
“Inflation will be killed by the Fed,” “Given the nature of this inflation, which is far more related to supply constraints than booming demand, it is going to create a renewed recession.” Again, the volatility we’re seeing now is just the beginning of a bear market.
inflation is real, and that the Fed won’t have the guts to do what it will take to defeat it-tighten the economy into recession. “Recession [is] the only way to successfully fight inflation,” “They don’t have the backbone to do that.”
Because as painful the current drop has been, It’s next one that will hurt 😞

by Mahesh Kalbhor | Jan 28, 2022 | Weekly Update
What Are “Interest Rates” Anyway?
The Fed announced yesterday (Wed Jan 26th 2022 ) during press conference that interest rates are going up. And now the stock market’s going down… but why?? What the heck does the Fed have to do with interest rates, anyway? 🤔
For the unacquainted who’ve seen us talking about the importance of the Fed for a year, our obsession with interest rates might seem like infatuation. 😍 But that’s because interest rates affect many aspects of life in a country, its economy, and its markets. Let’s examine why:
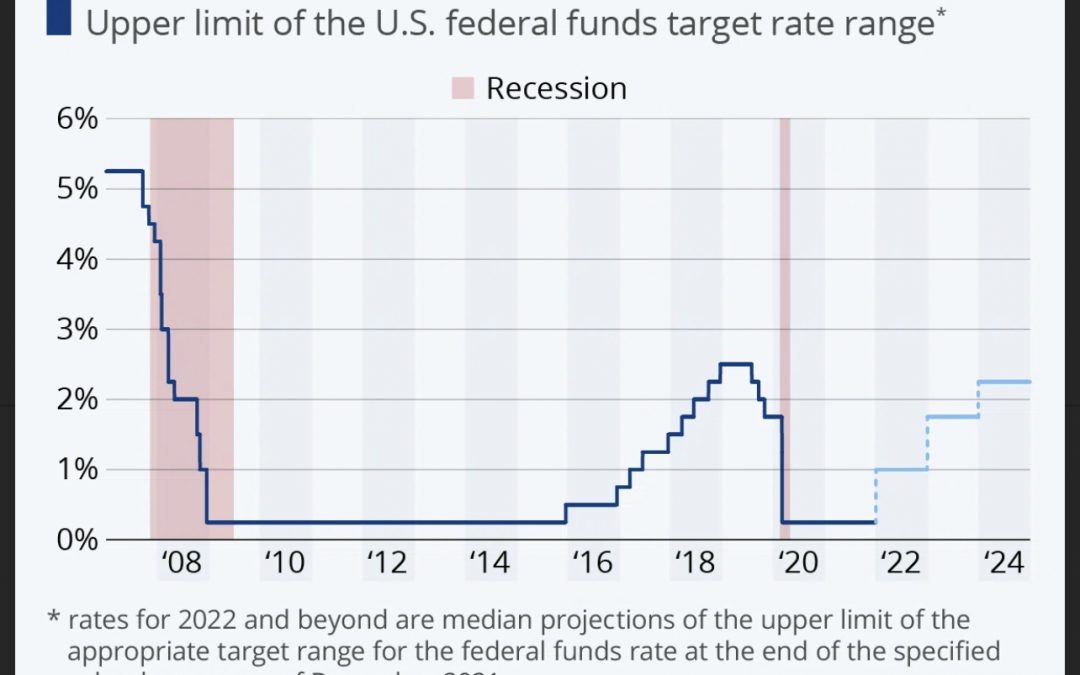
* The Federal Reserve controls the federal funds rate (this ‘interest rate’ JPow talks about), which is the target interest rate at which commercial banks can lend their reserves to each other. A bank’s reserves describe the cash that banks have to keep in actual vaults to make sure they have enough liquid money to satisfy a large withdrawal. The federal funds rate is important because it affects unemployment, economic growth, and inflation in the U.S. 🚨
* The federal funds rate affects other interest rates that you may be familiar with, such as interest rates on home or auto loans. 🚗 🏡Why does this relationship exist? Well, because the interest rate at which you have to pay back your car loan depends on the bank’s individual rate for you (this is known as the prime lending rate), and your individual rate is directly related to the federal funds rate.
* You probably heard yesterday that the Fed is going to ‘reduce its balance sheet’ and ‘raise rates.’ When the federal funds rate is low, it encourages people to invest or take out loans (because you have less interest to pay back.) That’s why the Fed lowered rates during the pandemic in an effort to incentivize people to participate in the economy in spite of lockdowns. The Fed also started buying bonds and other securities — ‘increasing the size of its balance sheet’ — in a process called quantitative easing to help lower interest rates.
* Although lowering rates and increasing asset purchases was an appropriate short-term monetary response to the pandemic-era economy, low rates and printing lots of money causes inflation in the long run, which is where we are now.
* So if raising rates helps combat inflation, why is the stock market reacting negatively? Because higher interest rates raise borrowing costs, disincentivize hiring, increase credit card rates, and generally slow down the economy (at least, temporarily.) And when the economy slows down, bonds become more appealing investments because they’re less risky — so investors are selling or switching to bonds to avoid losing money. 💡
At the end of the day, the Fed is reacting to inflation in a way that’s historically appropriate. The market just isn’t happy because, in the words of JPMorgan analyst David Stubbs, “What the market doesn’t like, is rapid changes in the monetary landscape.” 🤷

by Mahesh Kalbhor | Jan 28, 2022 | Weekly Update
The stock market is off to a rough start in 2022.
The S&P 500 Index turned lower after hitting a new all-time high on the first trading day of the year… It’s down roughly 10% over the past few weeks. Some of the other major indexes have suffered worse.
Whenever the market starts falling like this, many investors find themselves in a hole. The losses start to pile up… And these folks begin to panic.
If you’re one of these investors today – or if you just want to know how to get out of trouble the next time – I’m here to tell you…
Stop digging.
Now, that sounds easier than it is…
The problem is what psychologists call “confirmation bias.” It’s a fancy term that explains how people tend to look for facts or evidence that confirm what they already believe.
Even when we find information that conflicts with our original investment thesis on a stock, our brain only looks for the other side – the “good” data that supports it. And this confirmation bias can start an expensive lesson in stock-position management.
Some investors think they can overcome confirmation bias. They plan to just reevaluate their positions as the market ebbs and flows. But there’s a big problem…
As humans, we’re often too emotional for our own good. Even the best investors can ride a stock to near zero.
We’ve seen countless examples over the years, like the tech wreck in 2000 and 2001… the financial crisis and bear market of 2008 and 2009… and now, maybe it’s happening with “stay at home” stocks like Peloton Interactive (PTON), which I wrote about yesterday.
The pain of walking away is often too difficult… That’s especially true when your emotions tell you that your once-prized stocks are “just another day away from a turnaround.”
If you’re in a hole today, it’s time to stop digging. Here’s how…
The world’s best traders use programmatic signals that tell them when to walk away. Personally, I use the Power Gauge…
When the Power Gauge turns “bearish” on any of my stocks, I know it’s time to move on. But even without this system, you can still limit your downside with a basic strategy…
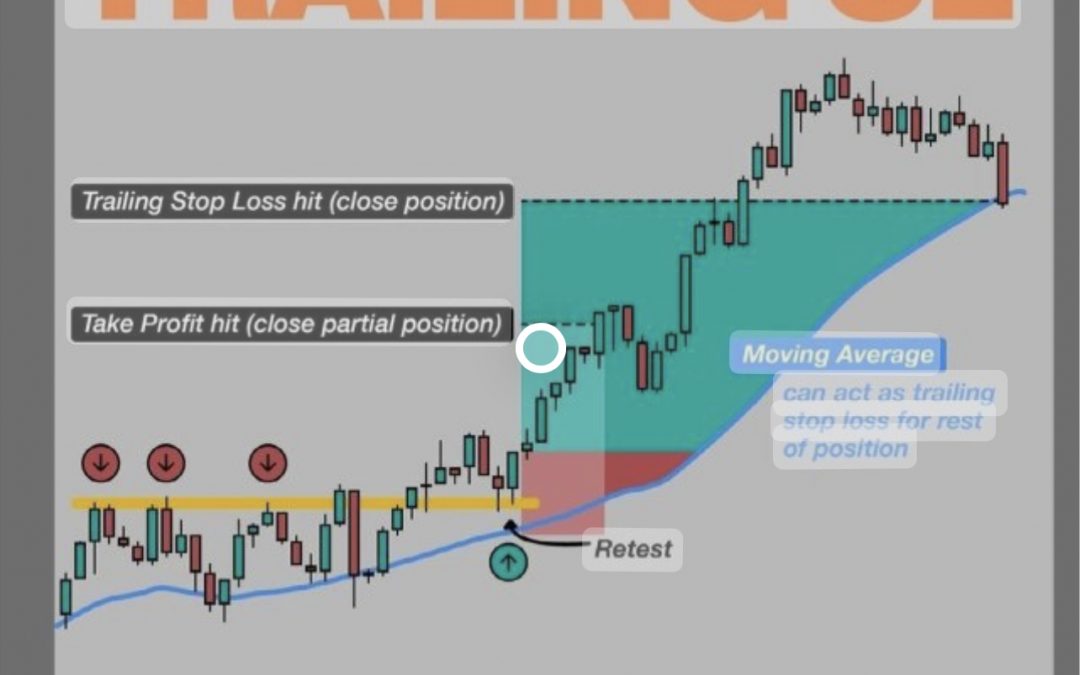
Use a trailing stop.
A trailing stop limits your losses in a single position to a preset amount. It imposes a discipline in your portfolio that helps you eliminate confirmation bias from the moment you invest. And it can save you money even when you’re just plain wrong.
It’s easy to execute, too…
Let’s say you buy a stock at $100 per share. You can set your initial stop loss at $80 per share… So your maximum loss would be $20 per share (or 20% of your position).
The “trailing” part is that your stop moves up with – or trails – the stock as it moves up.
So if the stock runs up to $125 per share, your 20% trailing stop would rise to $100 per share. In this example, your stop would always be 20% below the highest price for the stock… But it would never be less than the original $80 per share.
Using a trailing stop imposes discipline in your portfolio management that your brain can’t get in the way of… It takes your emotions out of the decision-making process.
In other words, it makes you stop digging when you’re in a hole… And that will save you a lot of pain – and money.

by Mahesh Kalbhor | Jan 27, 2022 | Weekly Update
What’s a correction?
A “correction” happens when an asset, an index, or an entire market falls 10% or more from its most recent high. And they typically last from days to months.

On Monday Jan 24th 2021 , the S&P 500 index was in jeopardy of closing in correction territory, but staged a turnaround with the broader market. The broad-market index needs to close above 4,316.90 to avoid a fall of 10% from its Jan. 3 record close.
On Thursday Jan 27th 2021 , The S&P 500 (.SPX) closed down but narrowly avoided a correction confirmation, after a session of gymnastic volatility that had the benchmark index advancing throughout the morning and gyrating below Wednesday’s closing level in afternoon trading. It closed the session just 10 points higher than what would officially have been deemed a correction, if it closed 10% below its most recent record close.
The small cap Russell 2000 (.RUT) however did confirm that it was in a bear market, closing down 2.3% on the day and more than 20% below its Nov. 8 closing high.
Nasdaq ($QQQ) — which mostly measures US tech stocks — has fallen 15% from its late November record through yesterday.
While they can be painful short-term, they’re normal for markets and can help reset pricier assets. Zooming out: The Nasdaq has had 66 corrections since 1971.
The index has registered a correction 65 times (not including Wednesday’s) since it was launched in 1971, and of those corrections, 24 of them, or 37%, have resulted in bear markets, or declines of at least 20% from a recent peak, according to Dow Jones Market Data.
More recently, corrections have served as buying opportunities, with the sojourn into correction territory on March 8 resulting in subsequent gains for the one-week, two-week, three week and one-month periods, going all the way out to six months. A similar uptrend took hold when the Nasdaq Composite slipped into correction territory in early September 2020.

Why are we in correction?
Lots of factors play into corrections, but this one is mostly related to inflation and interest rates. Let’s unpack that…
• Inflation… is at a 40-year high. To tame soaring prices (think: oil at the pump, bacon at checkout), the Fed is expected to hike interest rates multiple times this year. ETA: as soon as March.
• Rising rates… can be bad for growth stocks like tech. Higher rates can make US government bonds and savings accounts more attractive vs. riskier assets like tech — whose share prices are often driven by expected future growth. As rates and inflation rise, the value of a company’s potential growth falls.
• Also… some companies that thrived during the pandemic have seen earnings slow this year, like tech stocks and banks – playing into the correction.
$QQQ: Tech shares soared during the pandemic while the Fed slashed interest rates to zero to fuel the economy. Now that inflation keeps rising, the Fed is ending the stimulus party — and frothy valuations are being “corrected.”
What could be the takeaway for retail investors?
It depends on your strategy and other factors like your age, finances, and risk tolerance. For some long-term investors, corrections can be a temporary dip toward reaching investing goals. Portfolios that are diversified across different types of industries and investments can be less affected by corrections when certain assets decline.
Of course, even if the market recovers, there’s never a guarantee that individual stocks or portfolios will follow the same trajectory. Though some recoveries took longer than others, historically the US market has bounced back from corrections over time.
History of market corrections –


by Mahesh Kalbhor | Jan 23, 2022 | Earnings
Weekly update – 1/23/22
The market got hammered last week and bullish traders and investors were not pleased as all the major indexes cooled off in an aggressive way. Continued worries over inflation, what the Federal Reserve is going to do and the threat of Russia invading Ukraine kept buyers at bay. That was too much for market participants to digest apparently, and those issues will carry over into this week. The S&P 500 is fighting to hold its 200-day moving average (and currently losing), which is a level it had not tested since June 2020.
It was an ugly finish to an ugly week for investors and long only traders. The selling hit every sector which can happen when the margin calls start happening. I think things are getting a little extreme to the oversold side so expect a bounce next week.
•QQQ ~ support at 340, (now 351)
•SPY ~ support at 430, (now 438)
•DOW ~ support at 34,000, (now 34,265)
•IWM ~ lost big support at 210-212, new support 190 (now 197)
Speaking of the Federal Reserve, members will most likely raise rates on Wednesday, but will it be 25, 50 or more basis points higher? Obviously, that decision could cause more volatility up to and after the announcement on Wednesday afternoon.
In addition, several other important economic reports are due out this week with many listed below.
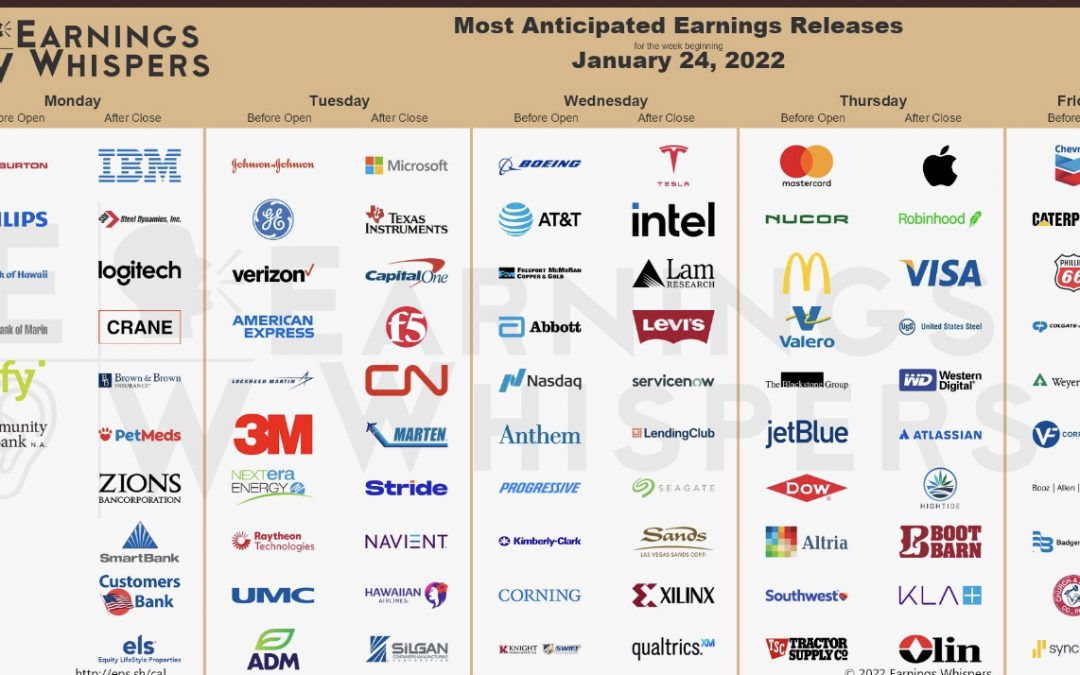
Quarterly earnings will continue to accelerate this week with several big-name stocks like Apple and Tesla expected to release. Stay disciplined and focused, and remember that there is nothing wrong with sitting on your hands if you don’t think you have an edge.
The Jan Seasonal Trade
We are currently buying QQQ puts in line with the “January Defect” trade discussed in the last two issues. However, a week from now, a strongly positive seasonal trade will set up – the one we call “The Jan Seasonal.” One buys “the market” on the close of the 18th trading day of January, and holds for four trading days. Take profits on half the trade if SPY rises by 8 points from where it was when you established the position. For now, we will plan to exit all (remaining) calls four trading days later, at the close on Wednesday, February 2nd. #
Jan Seasonal Bullish Trade
At the close of trading on Thursday, January 27
Buy 2 SPY Feb (11) at-the-money calls and
Sell 2 SPY Feb (11) calls with a striking price 10 points higher.
Potential $VIX “spike peak” Buy Signal
There will be a new “spike peak” buy signal when $VIX closes at least 3.00 points below the highest price that it has reached during this current “spiking mode.” As of this moment, that high is 29.79, set during the day of January 21st.
$VIX “spike peak”
IF $VIX closes at least 3.00 points
Buy 2 SPY Feb (18th) at calls and
Sell 2 SPY Feb (18th) calls with a striking price 13
If bought, then stop yourself out if $VIX closes above that previous high price.#
Economic calendar 🗓 this week:
Jan 25: Consumer Confidence
Jan 26: Trade in Goods
Jan 26: New Home Sales
Jan 26: FOMC Announcement
Jan 27: Jobless Claims
Jan 27: GDP
Jan 27: Durable Goods
Jan 27: Pending Home Sales
Jan 28: Personal Income and Spendin
Earnings Calendar 🗓 this week: