by Mahesh Kalbhor | Feb 28, 2022 | Weekly Update
• The 55-day rule – there hasn’t been a top that lasted for 55 days without the market imploding (in 2020, the market dropped almost immediately after the top was formed, but that was due to the pandemic of course).
• Most people don’t realize that the Crash of 1929 and the Crash of 1987 both occurred exactly 55 calendar days after the stock market had topped. All prices in this article are closing prices on the day being referenced. 1929: the peak in the Dow was reached on September 3rd, when it closed at 381.17. 55 calendar days after September 3rd was (Monday) October 28th. That was the exact date of the Crash of 1929, with the Dow down 40.58 points, or 13.5%. 1987: the Dow topped out at 2722.42 on August 25th. 55 calendar days later was (Monday) October 19th when the Dow collapsed 507.99 points, or 22.6% in one day! This year, the Dow topped out on January 4th, and 55 days later is Monday (!) February 28th.
• In both 1929 and 1987, there was a sharp market decline in the week preceding the Crash (especially on the Friday before), so that is something else to watch for. These Crashes just didn’t appear out of thin air. Fibonacci fans like the fact that 55 is a Fibonacci number. There is probably something there with biometrics, too (remember that?). Of course, there is no real explanation, except for the fact that in both cases, 55 days of not seeing stocks go up was about all people could take. In both cases, most stocks had already started downward, just as they have over the last eight months.
• Other “crashes” don’t line up so neatly. The Flash Crash of 2010 and the “Tech Stock Massacre” of April 14, 2000, both occurred far closer than 55 days to the previous market top. In recent years, there have been only a few times where a market top has lasted for more than 55 days. Usually, by then, the market has recovered and is merrily on its way to new highs. However, in 2013 and in 2016, the 55-day Rule was “in play,” but did not produce a crash. The sharp market selloff of August 2015 was “related” to the 55-day time period but did not line up exactly.
• For whatever it’s worth, the 55-day period has proven to be problematic in a big way two times in the past. To ignore the possibility of a third occurrence could be detrimental to your net worth. So, if you want to trade this, always Buy 10 SPY puts 10% out of the money when the market is at its peak.
by Mahesh Kalbhor | Feb 20, 2022 | Weekly Update
The Nasdaq Composite index may be in for trouble, but then again it may not.
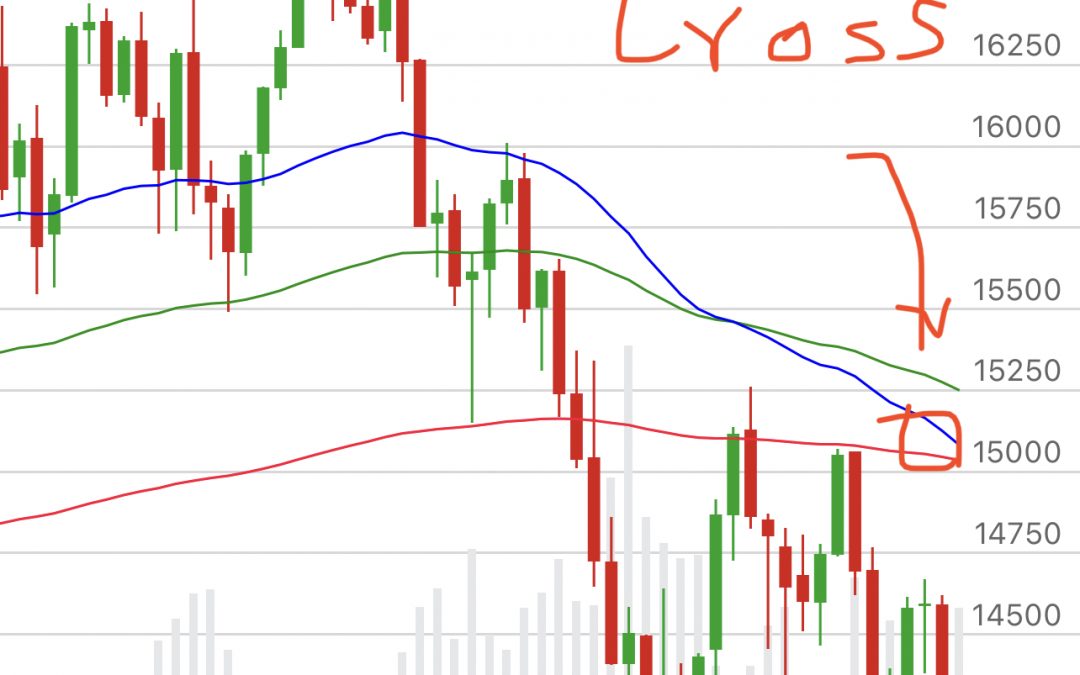
The index has formed a “death cross” chart pattern, meaning its 50-day moving average has dropped below its 200-day moving average.
That can be a sign of trouble ahead for stocks. For example, the pattern arose in June 2000, soon after the stock-market plunge began, and it emerged in January 2008, before the financial crisis, Bloomberg reports.
But the death cross also can be a lagging indicator. It showed up in April 2020, after the Nasdaq hit its trough the previous month.
The Nasdaq already has slid 16% from its Nov. 19 closing high.
Since 1971, the index has hit a death cross 31 times, and in 77% of those cases, the index was higher six months afterward, according to Potomac Fund Management, as cited by Bloomberg.


by Mahesh Kalbhor | Feb 15, 2022 | Earnings
News and Sentiments
Stocks traded fairly sideways till Friday’s 2/11/22 action pushed them to much lower levels for the week with the three major indexes all closing below their 200-day moving averages again. With chances increasing that the Federal Reserve may boost rates 50 basis points soon, and Russia will move into Ukraine, it may be tough sledding ahead for bullish traders. That said, the market has been resilient in the past, so a move higher would not and should never be out of the question. Earnings calls continue to slow, but there are several big-name companies expected to announce this week, including Alibaba, Baidu and NVDIA. As far as economic reports go, several are on tap, including the notes from the Fed’s last meeting. It’s unclear whether there will be any more insight to how the Fed is leaning before the next meeting, but it might be worthwhile to keep an eye on the market Wednesday 2/16/22 afternoon.
The overall picture for SPX is bearish. Both bulls and bears are hard-pressed to make money in bear markets. There is support near 4360 – the lows of yesterday (2/14/22) . The next important support level below that is in the 4200-4300 area, which if taken out will likely set off sharper downside action towards the next support level at 4000. As for resistance, it begins at 4600 and – after the long-time $SPX spent traversing the trading range in November and December – is evident all the way up to the highs above 4800
What happening this week:
• 2/15 – Tue PPI .
• 2/16 -Wed – Retail Sales data; FOMC meeting minutes
• 2/17 – Thu – Jobless claims
• Continue to watch the 2 year and 10 year treasury yield for a close in the gap between the two.
• VIX – popped up on CPI and Russia. Watch for more volatility
• US dollar continues to find some strength.
• Earning season continues.
Sectors in Play
• Energy very extended on oil but trend still is looking for higher.
• Financials continue to do OK in a rising interest rate environment. Pulling back so maybe an opportunity to add back
• Gold – ready to move. Geopolitical concerns pushing it higher .
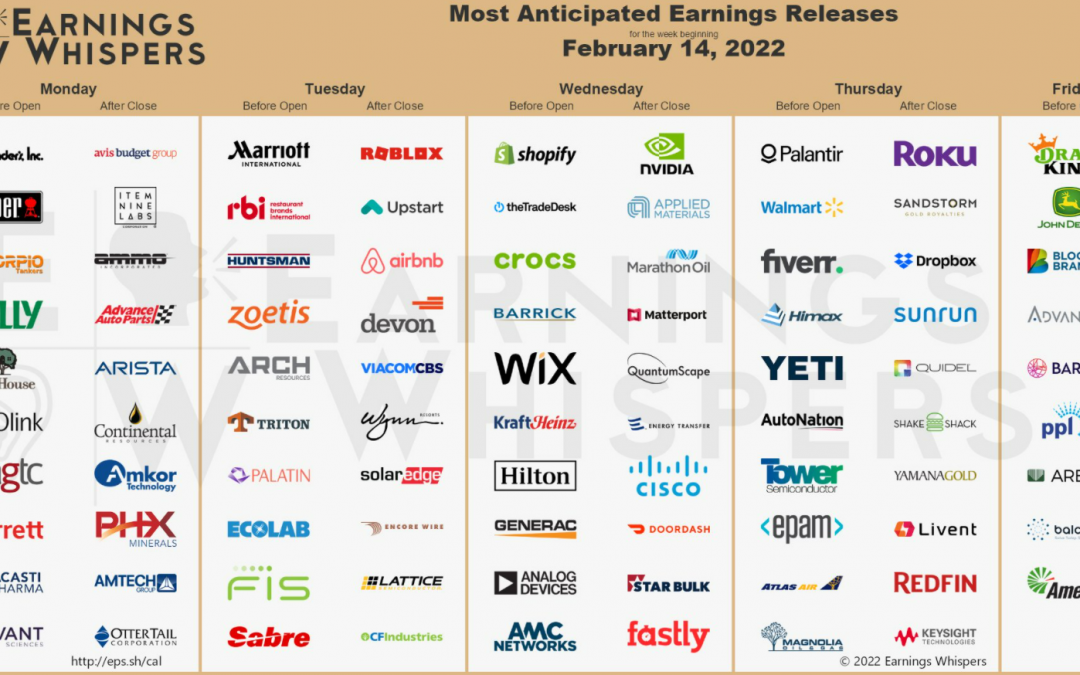
Earnings:
•Monday – AAP, CAR amc
•Tues- VIAC, MAR bmo and RBLX, UPST, ABNB amc
•Wed – SHOP bmo and NVDA, AMAT and CSCO amc
Watchlist :
SPY – Add long put as hedge when SPY hits 452 / 458 area
PYPL – $120 did not hold, next support maybe around $107
USO and oil sector – still looking strong but extended run.
SQ – double bottom with support around $100.
WCC – long for infrastructure play. In and out this week. Will watch for another long entry at $120.
XLF – possible support around $37.5

by Mahesh Kalbhor | Feb 13, 2022 | Weekly Update
BEAR MARKET RULES:
1. Overbought conditions in a bear market — expect a new down leg.
2. Oversold conditions in a bear market — “thin ice”, no solid foundation for price bounces.
3. Buying into a bear market is dangerous regardless of the bullishness of the chart.
4. Expect bearish conclusions to bullish chart patterns.
5. Manage long-term positions as if they were short-term positions.
The charts on Wednesday 2/9/22 did look promisingly bullish. After Thursday 2/10 morning’s big drop from the rising trend channel likely due to the CPI report showing accelerating inflation, price was beginning to make its way back to positive territory. Then it fell apart. The breakdown was exacerbated by St. Louis Fed President Bullard suggesting a full percentage point rate hike by July. So it was a double whammy for the market.

After the market closed on Thursday, we identified an downside initiation climax. A downside initiation climax tells us to expect more decline. We were churning this morning and losing ground. Then we got the news that the White House was expecting Russia to invade Ukraine before the finish of the Olympics. The market sold off in earnest.
A climax is a one-day event when market action generates very high readings in (primarily) breadth and volume indicators. We also include the VIX, watching for it to penetrate outside the Bollinger Band envelope. Climaxes indicate either initiation of a price move or exhaustion of the current trend.
Conclusion: When the market is correcting or in a bear market, we need to remember that bullish expectations should be tempered. Oversold conditions that you we see often in bear markets become “thin ice”, a poor foundation for an extended rally. That is what I forgot on Wednesday. Lesson learned.


by Mahesh Kalbhor | Feb 12, 2022 | Weekly Update
A turbulent start of the year for U.S. stocks has entered a new phase in recent days, with investors weighing good news about corporate earnings and the labor market against the stubborn challenges of high inflation, rising bond yields, and geopolitical uncertainty ( Ukraine Invasion Threat by Russia)
A driving force behind many market swings remains the increase in U.S. government bond yields, fueled by escalating expectations for how high the Federal Reserve will raise short-term interest rates this year.
Yields, which rise when bond prices fall, are a bedrock gauge for investors because they help dictate borrowing costs on everything from mortgages to corporate debt. They are also a major component of financial models used to value stocks and other assets. All else being equal, the ability to earn higher returns on risk-free bonds makes the future earnings of businesses less valuable, dragging down share prices.
For much of January, analysts widely agreed that this simple relationship was paramount for stocks. The yield on the benchmark 10-year U.S. Treasury note surged from 1.496% at the end of last year to 1.866% on Jan. 18. Stocks fell, led by technology (FB, AAPL, AMZN, GOOG, TSLA) companies, many of which are especially sensitive to rising rates because their value stems largely from their potential earnings down the road.
Since then, the relationship between bonds and stocks has grown more nuanced. Stocks were able to rebound over a period when bond yields stabilized, but they still rose broadly even when yields climbed sharply on Feb. 4, following a better-than-expected jobs report. Yet stocks fell Thursday after consumer-price index (CPI) data showed inflation reached another four-decade high last month, and equities extended declines Friday in the midst of growing worries about a potential Russian invasion of Ukraine.
By the end of Friday 2/11, the S&P 500 had logged its fourth weekly decline out of the past six weeks, falling 1.8%. The 10-year yield settled at 1.951%, down from 2.028% on Thursday 2/10, setting up a week in which investors will track the latest developments on the Russia-Ukraine situation, earnings from the likes of ZoomInfo Technologies Inc. and Airbnb Inc., and clues from Fed officials about their plans for the March policy meeting.
In recent weeks, several factors have helped stocks. One has been a solid round of fourth-quarter corporate earnings. The strong jobs data further bolstered the economic outlook, while January’s stock slump made prices start to look more attractive to some investors. Few, however, found silver linings in Thursday’s (2/10/22) inflation data, a reminder of the hard-to-predict economic trends that could keep investors on edge this year. Reports that Russia is on the verge of invading Ukraine added another blow, sending both stocks and bond yields sliding as investors rushed into safer assets such as Bonds (TLT) and TLT jumped high on Friday 2/11.
Typically, the early years of rate-increase campaigns have worked out for investors. The past six times the central bank has raised rates, stocks have generated positive returns each time in the first year and five out of six times in the second year, according to a Bank of America report from November. The one exception came when rate increases possibly helped burst the tech bubble around the turn of the millennium.
Fed rate-increase cycle could be more dangerous than some others because stocks have entered at elevated valuations. Companies in the S&P 500 traded late last year at nearly 39 times their cyclically adjusted earnings, higher than at any other point apart from the tech bubble.
Valuations, though, aren’t quite as high by other measures and are now lower after January’s selloff. S&P 500 companies traded late last month at as low as 19.3 times projected earnings over the next 12 months, according to FactSet, falling below 20 for the first time since April 2020. That was down from a 21.5 multiple entering the year, though still above the five-year average of 18.9.
Conclusion
“We know that markets don’t like uncertainty, but we think this cycle will play out like the others where the economy and corporate profits are strong enough that we’ll be higher at the end of the year than we are now,” . “The market will become comfortable with the path of rate hikes, probably within the next several months.”
Long term outlook remains largely bullish on the U.S. stock market. In particular, there are opportunities to buy software companies and chip makers—eg. companies which have strong fundamentals and attractive valuations after the recent selloff in growth stocks.
The upside is limited because…growth is going to slow and the Fed is going to get more aggressive.”