by Mahesh Kalbhor | Jan 28, 2022 | Weekly Update
The stock market is off to a rough start in 2022.
The S&P 500 Index turned lower after hitting a new all-time high on the first trading day of the year… It’s down roughly 10% over the past few weeks. Some of the other major indexes have suffered worse.
Whenever the market starts falling like this, many investors find themselves in a hole. The losses start to pile up… And these folks begin to panic.
If you’re one of these investors today – or if you just want to know how to get out of trouble the next time – I’m here to tell you…
Stop digging.
Now, that sounds easier than it is…
The problem is what psychologists call “confirmation bias.” It’s a fancy term that explains how people tend to look for facts or evidence that confirm what they already believe.
Even when we find information that conflicts with our original investment thesis on a stock, our brain only looks for the other side – the “good” data that supports it. And this confirmation bias can start an expensive lesson in stock-position management.
Some investors think they can overcome confirmation bias. They plan to just reevaluate their positions as the market ebbs and flows. But there’s a big problem…
As humans, we’re often too emotional for our own good. Even the best investors can ride a stock to near zero.
We’ve seen countless examples over the years, like the tech wreck in 2000 and 2001… the financial crisis and bear market of 2008 and 2009… and now, maybe it’s happening with “stay at home” stocks like Peloton Interactive (PTON), which I wrote about yesterday.
The pain of walking away is often too difficult… That’s especially true when your emotions tell you that your once-prized stocks are “just another day away from a turnaround.”
If you’re in a hole today, it’s time to stop digging. Here’s how…
The world’s best traders use programmatic signals that tell them when to walk away. Personally, I use the Power Gauge…
When the Power Gauge turns “bearish” on any of my stocks, I know it’s time to move on. But even without this system, you can still limit your downside with a basic strategy…
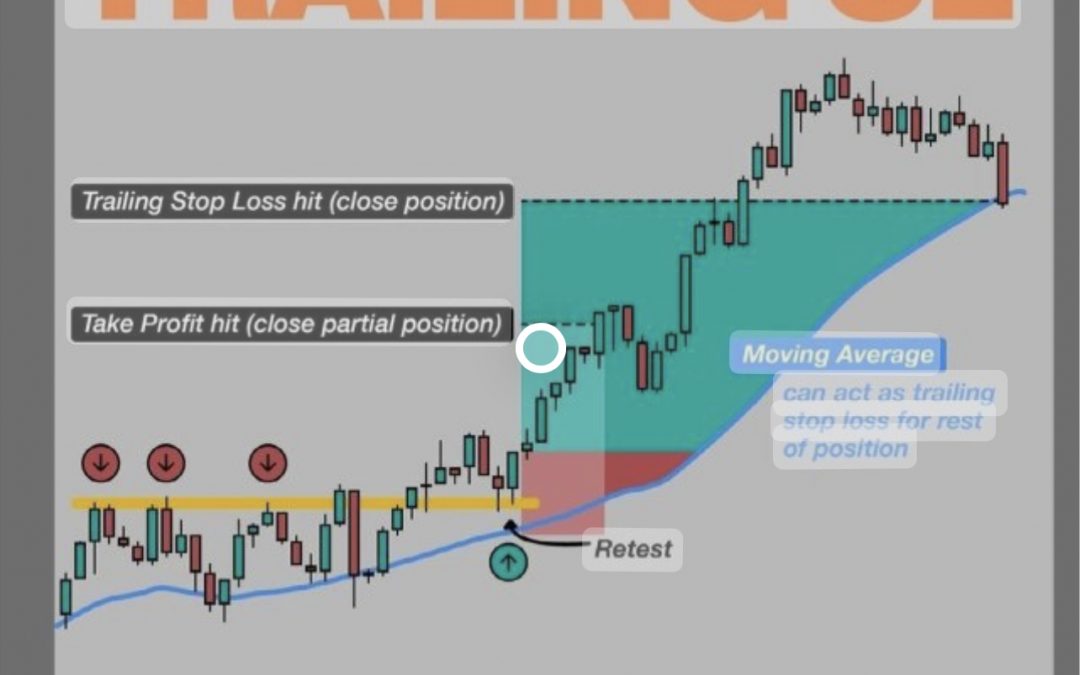
Use a trailing stop.
A trailing stop limits your losses in a single position to a preset amount. It imposes a discipline in your portfolio that helps you eliminate confirmation bias from the moment you invest. And it can save you money even when you’re just plain wrong.
It’s easy to execute, too…
Let’s say you buy a stock at $100 per share. You can set your initial stop loss at $80 per share… So your maximum loss would be $20 per share (or 20% of your position).
The “trailing” part is that your stop moves up with – or trails – the stock as it moves up.
So if the stock runs up to $125 per share, your 20% trailing stop would rise to $100 per share. In this example, your stop would always be 20% below the highest price for the stock… But it would never be less than the original $80 per share.
Using a trailing stop imposes discipline in your portfolio management that your brain can’t get in the way of… It takes your emotions out of the decision-making process.
In other words, it makes you stop digging when you’re in a hole… And that will save you a lot of pain – and money.

by Mahesh Kalbhor | Jan 27, 2022 | Weekly Update
What’s a correction?
A “correction” happens when an asset, an index, or an entire market falls 10% or more from its most recent high. And they typically last from days to months.

On Monday Jan 24th 2021 , the S&P 500 index was in jeopardy of closing in correction territory, but staged a turnaround with the broader market. The broad-market index needs to close above 4,316.90 to avoid a fall of 10% from its Jan. 3 record close.
On Thursday Jan 27th 2021 , The S&P 500 (.SPX) closed down but narrowly avoided a correction confirmation, after a session of gymnastic volatility that had the benchmark index advancing throughout the morning and gyrating below Wednesday’s closing level in afternoon trading. It closed the session just 10 points higher than what would officially have been deemed a correction, if it closed 10% below its most recent record close.
The small cap Russell 2000 (.RUT) however did confirm that it was in a bear market, closing down 2.3% on the day and more than 20% below its Nov. 8 closing high.
Nasdaq ($QQQ) — which mostly measures US tech stocks — has fallen 15% from its late November record through yesterday.
While they can be painful short-term, they’re normal for markets and can help reset pricier assets. Zooming out: The Nasdaq has had 66 corrections since 1971.
The index has registered a correction 65 times (not including Wednesday’s) since it was launched in 1971, and of those corrections, 24 of them, or 37%, have resulted in bear markets, or declines of at least 20% from a recent peak, according to Dow Jones Market Data.
More recently, corrections have served as buying opportunities, with the sojourn into correction territory on March 8 resulting in subsequent gains for the one-week, two-week, three week and one-month periods, going all the way out to six months. A similar uptrend took hold when the Nasdaq Composite slipped into correction territory in early September 2020.

Why are we in correction?
Lots of factors play into corrections, but this one is mostly related to inflation and interest rates. Let’s unpack that…
• Inflation… is at a 40-year high. To tame soaring prices (think: oil at the pump, bacon at checkout), the Fed is expected to hike interest rates multiple times this year. ETA: as soon as March.
• Rising rates… can be bad for growth stocks like tech. Higher rates can make US government bonds and savings accounts more attractive vs. riskier assets like tech — whose share prices are often driven by expected future growth. As rates and inflation rise, the value of a company’s potential growth falls.
• Also… some companies that thrived during the pandemic have seen earnings slow this year, like tech stocks and banks – playing into the correction.
$QQQ: Tech shares soared during the pandemic while the Fed slashed interest rates to zero to fuel the economy. Now that inflation keeps rising, the Fed is ending the stimulus party — and frothy valuations are being “corrected.”
What could be the takeaway for retail investors?
It depends on your strategy and other factors like your age, finances, and risk tolerance. For some long-term investors, corrections can be a temporary dip toward reaching investing goals. Portfolios that are diversified across different types of industries and investments can be less affected by corrections when certain assets decline.
Of course, even if the market recovers, there’s never a guarantee that individual stocks or portfolios will follow the same trajectory. Though some recoveries took longer than others, historically the US market has bounced back from corrections over time.
History of market corrections –


by Mahesh Kalbhor | Jan 23, 2022 | Weekly Update
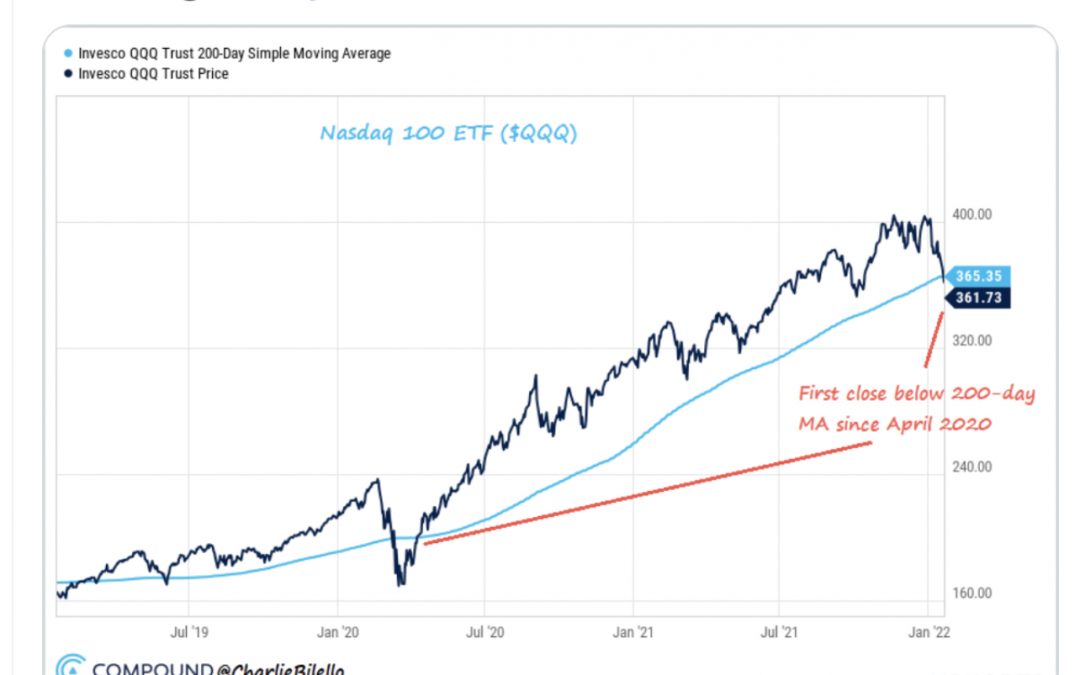
The Nasdaq 100 ETF closed below its 200-day moving average today for the first time since April 2020, ending one of the longest runs in history (450 tradingdays). $QQQ


by Mahesh Kalbhor | Jan 23, 2022 | Weekly Update
Stock market 📈 survival tips –
1. Buy what you know – Never buy a stock whose intrinsic value you can’t estimate reliably – and always get a big discount when you buy.
2. Allocate to value: Wait to make major investments when other investors are panicking and truly safe, outstanding opportunities abound.
3. Use good money-management techniques. Follow position-sizing guidelines and trailing stop losses. Never own more positions than you can carefully follow. Always keep a large cash reserve.
4. Do everything you can to avoid fees and taxes. Simply avoiding a 2% annual fee against your asset base (by not using money managers) is the No. 1 surest way to outperform your peers.
by Mahesh Kalbhor | Jan 13, 2022 | Weekly Update
CPI Index
The Labor Department reported December’s consumer price index 1/12/22— and it wasn’t pretty. Inflation was up 7% YoY in December. The last time the CPI rose that quickly was 40 years ago, in 1982. The consumer-price-index (CPI) measures how much Americans pay for goods and services. In November, the CPI was up 6.8% YoY, so the December report represents a 0.2% month-over-month increase in inflation. Similarly, the core price index (basically the CPI, just excluding food and energy categories) saw a 5.5% YoY increase in December.
Read more here : https://www.wsj.com/articles/us-inflation-consumer-price-index-december-2021-11641940760?mod=hp_lead_pos1

Inflation
In 1980, inflation reached a peak of 14.8% under Jimmy Carter’s presidency. Like today, the Fed Chair in the early 80s, Paul Volcker, made it his mission to squash inflation. Volcker raised interest rates to 19% in 1981, prompting a recession — however, in 1982, both interest rates and inflation began to fall dramatically. Volcker is still remembered as somewhat of a legend who killed double-digit inflation.

FED – Tapering and Balance sheet
The Fed’s already tapering at breakneck speed, aiming to be done by March. Remember, though: tapering just means reducing the speed at which they add assets to their balance sheet. So the balance sheet still grows, but slower and slower until it grinds to a halt.
What the Fed hasn’t discussed much yet is shrinking that balance sheet.

Since the beginning of the pandemic, the Fed has added more than $4 trillion in Treasury bonds and mortgage-backed securities to its holdings… More than doubling their balance sheet from $4.1 trillion to over $8.7 trillion. Thanks to print money technique by FED to boost economy. And they’re still buying for a couple more months, albeit more slowly. In December, the Fed implied they were just starting to talk about trimming down the balance sheet. Trimming the balance sheet is linked to interest rates — selling bonds takes money out of the economy and pushes bond prices down, raising rates. We know the Fed promised 3 this year. They never explicitly mentioned a 4th, but many analysts expect a more aggressive approach at this point.
January FED meeting (1/25 and 1/26) is in 2 weeks. We’ll know more by the end of this month.
The Fed – Meeting calendars and information (federalreserve.gov)
Trade safe ..!!

by Mahesh Kalbhor | Jan 6, 2022 | Weekly Update
Taper Tantrum was in full force yesterday after the Fed Minutes came out at 2 PM (1/5/2021) with the Markets behaving like a child, even though the news about raising interest rates was already signaled on Dec 15th 2021 after the last Fed meeting.
At this point it is a bit overdone.
Bitcoin also tanked after the Federal Reserve released twinkles of its December meeting, with policy makers indicating growing apprehension over affectation and the eventuality for interest rates to start rising as soon as this March.
Bitcoin was down more than 4% , soon after the Fed made the meeting minutes public. Fed officers indicated that inflation and tight labor conditions could warrant an interest- rate increase sooner or at a faster pace than anticipated. The minutes also indicated that the Fed may start to shear back its $8.8 trillion balance distance “ fairly soon” after raising its standard rate.
The selloff in Bitcoin coincided with a sharp downturn in equities, with tech taking it particularly hard. The selloff in Bitcoin is another sign that it’s acting more like a tech stock than an hedge such as digital gold.
If Bitcoin and other cryptos aim to be viewed as true digital assets then will need to start performing that way. So far, the markets are treating them like high- growth bets.
Trade Safe ..!!