by Mahesh Kalbhor | Jan 6, 2022 | Weekly Update
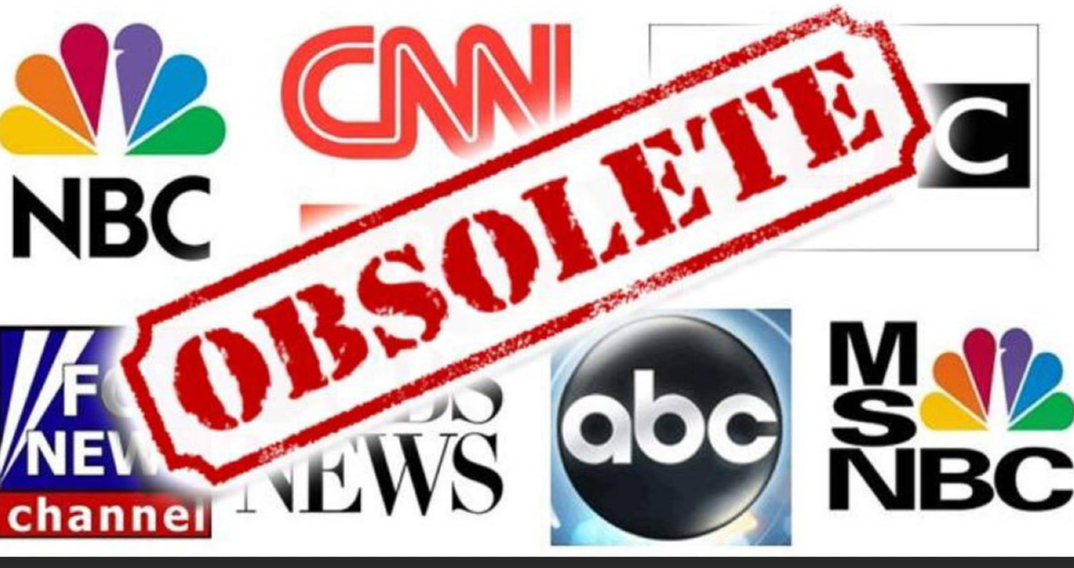
Sell the fear scenario plays out over and over again specially on CNBC.
A crisis occurs… The facts on the ground change… Things start looking up… And yet, the media keeps beating on the “fear” drum for many more months – or perhaps even years.
Housing crisis – 2008
You might remember the “double-dip recession” narrative from the 2008 housing crisis, for example. Cable-news outlet CNBC kept beating on the fear drum all the way into 2010…The market had soared over 60% in less than a year at that point. And not surprisingly, the facts on the ground had changed dramatically by then, too. It didn’t matter to the media… The market responded, but the media kept beating on the fear drum.
COIVD-19 and Omicron
When it comes to COVID-19, the facts on the ground have changed. The market is responding… But once again, the media is still busy beating on the fear drum. We’re sure you’ve heard about the Omicron variant of COVID-19 by now. Since its emergence, the media seems to be beating on the fear drum louder than ever.
First, Omicron spreads easier than previous COVID-19 variants. And as a result, a lot of people are getting it. You might’ve even been forced to change your holiday plans because someone you know got it.
Second, Scientists discovered Omicron in early November. Since then, the market has traded mostly sideways. In fact, it’s up about 2% in that span… That’s far from “beating on the fear drum” material.
So yet again… it’s the media versus the market.
Third, Is the Omicron variant making COVID-19 the worst it has ever been right now? Or are things still getting better as the market’s 2% gain since its discovery seems to imply?
Well, the outbreak of Omicron hit the United Kingdom before it got to us here in the U.S. It’s one of the places hardest hit by the new variant. And the numbers from that country are clear. According to the U.K. Health Security Agency – which is similar to the U.S. Centers for Disease Control and Prevention (“CDC”) – the U.K. reported 198,348 confirmed Omicron cases as of December 29th 2021 . But in the same span, it only reported 57 deaths from Omicron. That’s a death rate of about 1 in 3,500.
In other words… you can see a clear decoupling of COVID-19 cases and deaths.
Lastly, What does that mean?
The facts show that the Omicron variant is by far the most dominant strain of COVID-19 circulating right now. But at the same time, its death rate is less than the flu. According to the CDC, the 2018-19 flu season had an estimated 29 million cases and approximately 28,000 deaths. That’s a death rate of about 1 in 1,000. That’s right… Based on the data from the U.K., Omicron appears to be killing 1 in 3,500 people. Meanwhile, a recent flu season here in the U.S. killed 1 in 1,000.
Have you ever seen the stock market go down because of the flu? Nope. And I’ve been doing trading for a long time.
With January now upon us, the economy is ready to hum along… Don’t get spooked as the media keeps beating on the fear drum about a new COVID-19 variant.
Summary
– It’s a great time to buy any dip in the market. And perhaps we’ll also soon see that Omicron is the good news we need to end the pandemic… It’s a variant that looks less deadly than the flu.
– The market always sees the facts…
Trade safe ..!!
by Mahesh Kalbhor | Jan 4, 2022 | Weekly Update
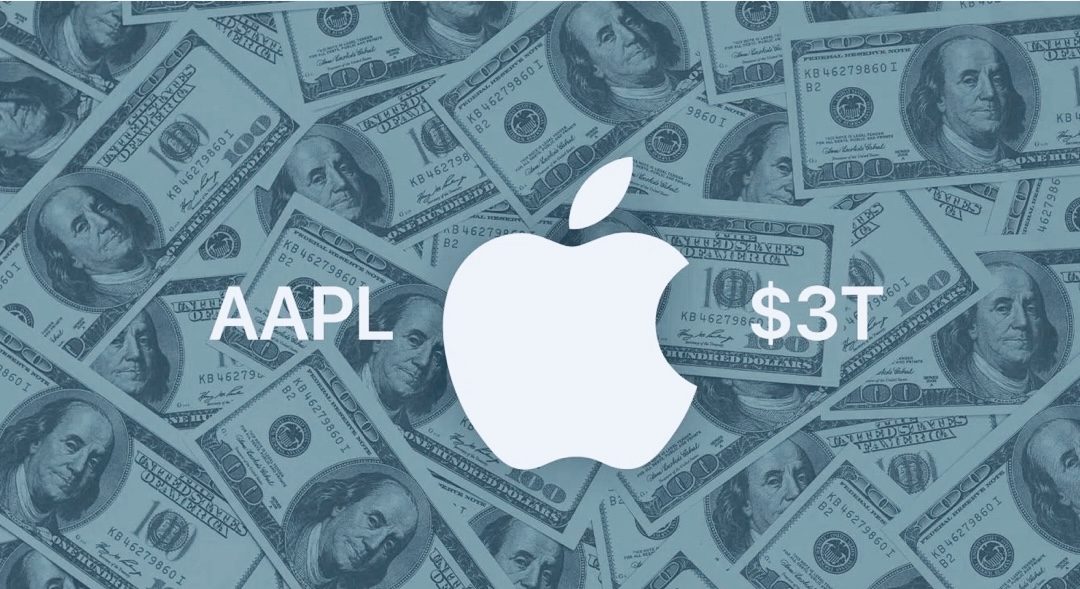
Apple Inc. briefly touched $3 trillion in market value, making it the first U.S. company to do so.
Apple was one the five biggest contributors to the S&P 500’s 27% rally in 2021 along with Microsoft Corp., Nvidia Corp., Alphabet Inc. and Tesla Inc., which together accounted for 31% of the index’s performance in 2021, according to S&P Dow Jones Indices data.

Share buybacks boost stock a company’s stock price by reducing the supply of shares in the market, effectively returning the money to investors. In addition, reduced share counts increase earnings per share, a metric used by many value-based investors to judge a stock.
Apple spent $85.5 billion to repurchase shares and $14.5 billion on dividends in Apple’s fiscal 2021 (which ended in September)
What’s next ?
Citi analysts expect Apple to announce another $90 billion in buybacks and to raise its dividend by 10%
by Mahesh Kalbhor | Jan 3, 2022 | Weekly Update
- Happy New Year everyone. I hope 2022 brings you good health, happiness and prosperity.
Santa Rally
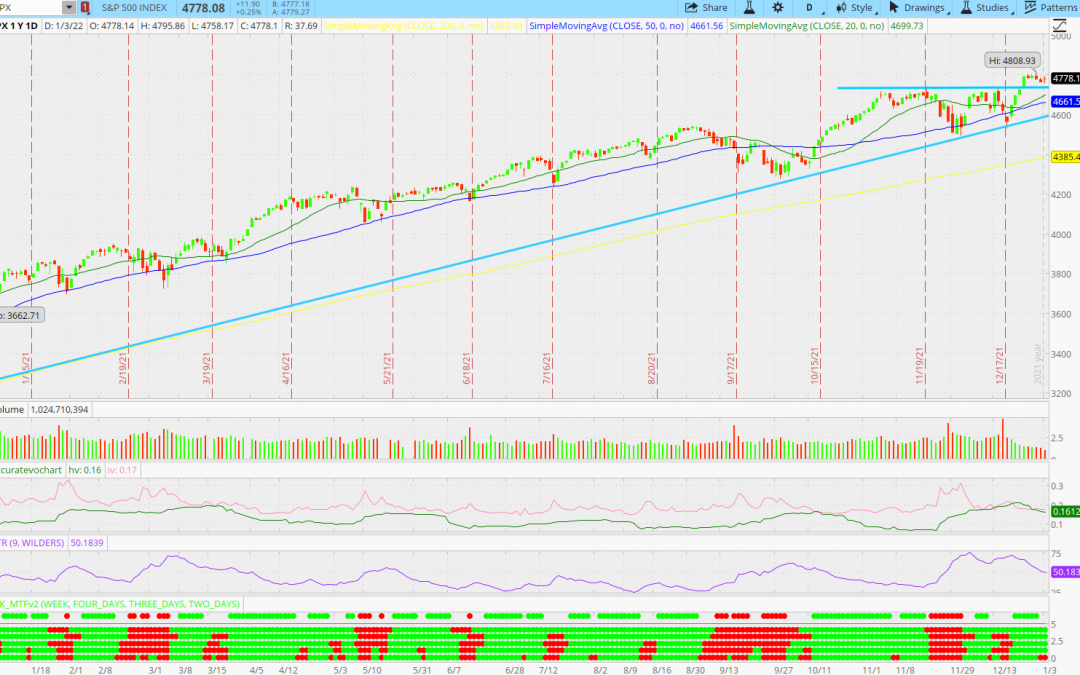
- Santa rally did not disappoint this year with the SPY having its best December since 2010.
- $SPX has put on a serious display of strength during Santa Rally .
- There was a 270-point rally over six trading days, from December 20th to 28th. Now, $SPX is trying to consolidate those gains
IWM and QQQ – Divergence
- The trouble lies beneath the surface, where extremely broad based indices such as the Russell 2000 ($RUT; IWM) and the NASDAQ (QQQ) Composite are lagging well behind.
- But, we have seen these negative divergences fairly frequently in the last six months. They did lead to limited selling in September and December, so this one may not $SPX has broken out, and the Dow and $NDX are not far behind. But many stocks are lagging.
- As for the $SPX chart, there should be support at the old breakout level near 4700, although that has not been tested yet. If $SPX should fall back below there, it would be back in its old trading range, with support at 4500. However, a pullback of that magnitude – while not necessarily setting off bear market alarms – would remove the current “bullish” status from the $SPX chart.
What happening this Week:
- Tesla car deliveries sets records. This record combined with the news flow coming from the Consumer Electronics Show (CES) this week will likely boost the tech sector and EV stocks specifically.
- Maybe the China stocks are finding a bottom.
- Continued US dollar weakness good for commodities and emerging markets.
Sectors in Play
Utilities, healthcare and defensive staple stocks were best performers last week.
Tech could catch a bid this week but overall, the sector has been showing some weakness.
Earnings:
Earnings on deck this week: Thursday – BBBY, WBA and STZ
Watching:
AAPL – strong run up – $180 put in a double top and $175 is moving average support. We may just consolidate here.
AMD – news at CES about new chip. $141 support and $155 resistance
BIDU – Strong Thursday. A break through $150 and next target is $155
DIS – break above $158 for continuation higher.
FB – Support $325 and resistance $350
LCID, NIO, XPEV, TSLA – in play Monday on good delivery news.
NVDA – maybe some CES news this week $290 is important support level.
Want new articles before they get published?
Subscribe to our Awesome Newsletter.
by Mahesh Kalbhor | Jan 1, 2022 | Weekly Update
In bull markets, upside surprises and downside disappoints.
The S&P 500 lost the critical SPX 4630 in late November, bottomed 2% shy of ideal downside support on Dec. 3, and now the index is already trading at new all-time highs. Thus, the SPX has so far carved out a nice 3rd top and 4th bottom almost precisely where it should have based on the typical Fibonacci extensions and retraces for these two levels.
Now, the next 5th Fibonacci top target 🎯 for SPX is 4960-4980 ideally. Once that level is reached a more another multi-week correction (low bottom target 🎯 is 4531 ) should unfold before the (final?!) run to SPX 6000 gets under way in year 2020.


by Mahesh Kalbhor | Dec 31, 2021 | Weekly Update
Jobless claims (people who continue to collect unemployment) fell to a pandemic-era low of about 1.716 million — below the expected 1.875 million and the lowest since pre-lockdown March 2020.
It seems employers are working hard to hold onto what little workforce they have right now. Also it does indicate we’re not seeing a huge new surge of layoffs or quitting.
Omicron doesn’t seem to be that bad compared to previous variants. Signs of milder symptoms and fewer deaths alongside a plethora of treatments make it a cakewalk compared to the early days. Potential workers might be afraid to go find work amid the newest variant (Omicron). But in my opinion, it probably won’t be all that bad.
This does inspire confidence in the Fed to continue with their aggressive taper. They wanted their improved labor data, and they got it.
by Mahesh Kalbhor | Dec 31, 2021 | Weekly Update
Winners 2021
It has been a roller coaster ride for US stocks this year, which have been whipsawed by the meme stcocks, reopening rallies, supply-chain issues, and new coronavirus delta and Omicorn variants.
However, S&P 500 still has notched 69 record closes for 2021 and returned around 30% year to date, thanks to stellar corporate earnings and loose monetary policies.
Some of the biggest gainers were shale producers, which have benefited as oil prices surged more than 50%.
Here are the top 10 best-performing S&P 500 stocks of the past year as of Tuesday’s close, based on data by Koyfin.
1. Devon Energy
Ticker: DVN ; Market Cap: $30.22 billion;YTD Performance: +198%
- Marathon Oil
Ticker: MRO ;Market Cap: $12.92 billion;YTD Performance: +150%
- Fortinet
Ticker: FTNT ; Market Cap: $59.81 billion ;YTD Performance: +146%
- Signature Bank
Ticker: SBNY ; Market Cap: $19.69 billion ;YTD Performance: +141%
- Ford Motor
Ticker: F ; Market Cap: $82.93 billion; YTD Performance: +137%
- NVIDIA
Ticker: NVDA; Market Cap: $761.13 billion; YTD Performance: +132%
- Diamondback Energy
Ticker: FANG; Market Cap: $20.07 billion; YTD Performance: +132%
- Bath & Body Works
Ticker: BBWI; Market Cap: $17.77 billion; YTD Performance: +131%
- Moderna
Ticker: MRNA; Market Cap: $98.01 billion; YTD Performance: +130%
- Nucor
Ticker: NUE; Market Cap: $32.72 billion; YTD Performance: +118%
Losers 2021
Investors lost $201 Billion On These 7 Giant Losers This Year