by Mahesh Kalbhor | Feb 4, 2024 | Weekly Update
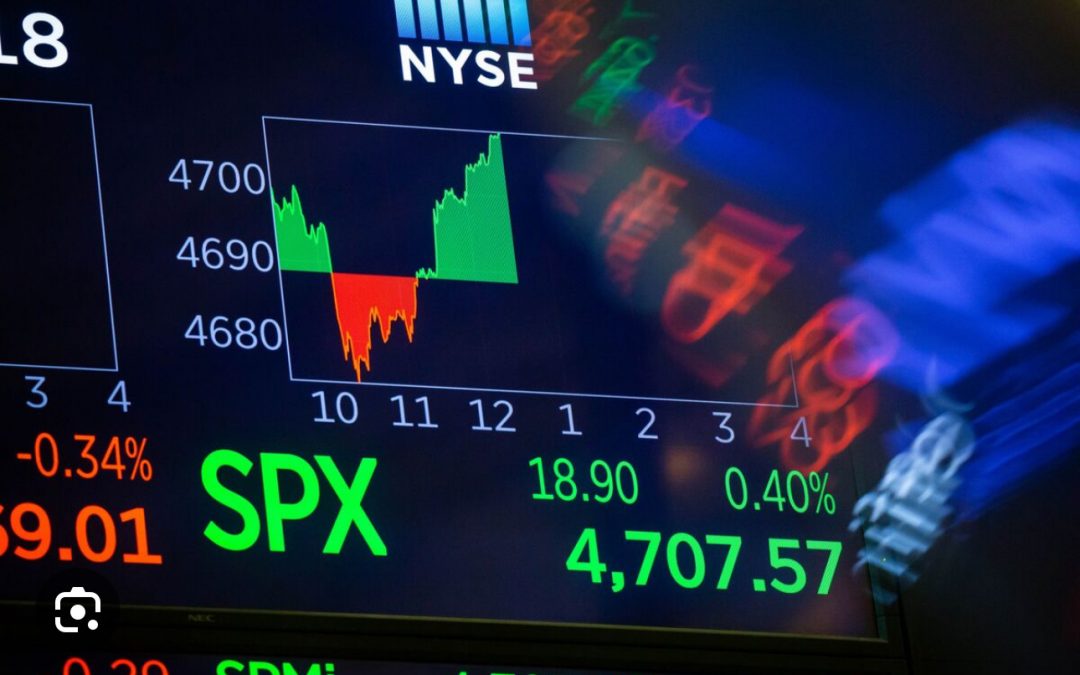
Following a robust surge to new all-time highs ) last week, $SPX encountered a setback on Wed 1/31. This was driven by disappointing earnings from notable companies like AMD, GOOG, and MSFT, alongside the conclusion of the FOMC meeting, culminating in a sharp 80-point selloff on Wednesday. Thursday saw a partial recovery, yet the market remains ensnared by news-related fluctuations. Friday brought positive earnings reports from AMZN and META (surged 20% after earnings), with an Unemployment Report signaling strength, dampening hopes of a rate cut. Despite these oscillations, the $SPX chart (all time high – 4958) maintains a bullish trajectory , finding support around 4800, extending to 4680 and some resistance if SPX crosses 5000 soon. As long as this range holds, the $SPX chart remains positive.
Technical analysis of equity-only put-call ratios suggests lingering sell signals, albeit with a neutral interpretation until a clear upward trend emerges.
Market breadth, previously robust since January 18th, briefly shifted to sell signals this week due to negative market action. Additional days of negative breadth could solidify sell signals.
Meanwhile, $VIX, despite minimal reaction to $SPX’s 80-point decline, maintains a low level, affirming the existing trend of $VIX buy signals. A low $VIX alone isn’t concerning; it’s the sharp upward spikes that pose issues.
Overall, a “core” bullish stance persists as long as the $SPX chart remains positive above 4800 
by Mahesh Kalbhor | Jan 27, 2024 | Weekly Update
On Friday, January 19th, the $SPX reached new all-time highs, both intraday and at closing. Since then, it has continued to climb, setting fresh closing records daily. Much of this surge appears driven by short covering and enthusiastic buying from previously underinvested longs. However, the market lacks the typical euphoria, as many individual stocks are struggling despite the index’s performance.
Having consolidated within the 4680-4800 range for nearly a month, $SPX should find substantial support in that zone. A close below 4680 would signal significant downside potential, although such a scenario seems improbable in the near term. Resistance levels are virtually nonexistent, given the index’s record-setting run.
Equity-only put-call ratios maintain sell signals for stocks, despite recent downward trends. Computer analysis still deems them bearish as long as they continue to rise, signaling caution for equities.
Breadth indicators improved alongside $SPX’s ascent, shifting to buy signals as the index hit new highs. They currently hover in overbought territory, reflecting positive market momentum. Additionally, the subdued $VIX further bolsters bullish sentiment, with no alarming spikes indicating potential trouble for stocks.
We maintain a core bullish stance, supported by the optimistic $SPX chart. We tactically trade confirmed signals while adjusting long call options upward as they deepen in-the-money. Although sell signals have been few and swiftly stopped out, we anticipate more to emerge should the market show signs of topping out. February historically carries risks, with 2018 and 2020 being particularly tumultuous, thus vigilance remains essential.

by Mahesh Kalbhor | Jan 20, 2024 | Weekly Update

Despite the worsening internal indicators such as put-call ratios, breadth, and New Highs vs. New Lows, the $SPX has not significantly weakened and remains close to its all-time highs. The NASDAQ-100 ($NDX) and the Dow ($DJX) have already achieved new all-time highs but face resistance at current levels. A decisive breakout above 4800 by $SPX would be highly bullish. And SPX did breakout above 4800 on 1/19/2024 (lead by AI semi conductors $NVDA $AMD etc.) almost after 2 years. Are we starting new bull market ? We shall see after 1/31/2014 FOMC meeting. Market is already pricing in 4-5 rate cuts in 2024. Support is observed just below 4700 (early January lows) with stronger support at 4600. A close below 4550 (December’s lows) would be a very negative signal, potentially signaling the start of another bear market.
Equity-only put-call ratios are on the rise, indicating a bearish outlook for stocks. They need to roll over and begin declining to turn bullish. Market breadth remains mostly poor, with breadth oscillators on sell signals and descending into deeply oversold territory, especially the “stocks only” oscillator. Despite $SPX not declining significantly, there seems to be an internal correction in the market, which could become a bullish factor when buy signals are confirmed later.
$VIX, while still subdued, has probed up to touch its declining 200-day Moving Average but quickly fell back. The trend of $VIX buy signal remains intact. A shift to “spiking” mode in $VIX could be somewhat negative for stocks, leading to sharp falls, but eventually triggering a “spike peak” buy signal.
Considering seasonality, there is a general negative trend from the 8th to the 18th trading day of January, followed by a strong positive seasonality from the 18th trading day into early February.
In summary, a “core” bullish position is maintained due to the generally positive $SPX chart, with other confirmed signals being traded around that core position.
by Mahesh Kalbhor | Jan 16, 2024 | Weekly Update
The $SPX hit new highs this week, surpassing 2024 levels. While the all-time highs were in January 2022 at 4818 (intraday) and 4796 (closing), recent numbers hover close. A two-day close above 4800 could signal the next bull market leg. Support at 4700 and stronger at 4600 exists, with a critical level at 4550. Closing below may hint at a bearish scenario. Equity-only put-call ratios rising indicate a bearish signal, affirmed by analysis programs. Breadth oscillators, echoing negative breadth, are on sell signals. Despite a low $VIX being bullish, attention remains on its trend. A “core” bullish position is held, with cautious trading around confirmed signals. 📈 #StockMarket #SPX #TradingSignals

by Mahesh Kalbhor | Mar 25, 2023 | Weekly Update

After years of low rates, inflation finally appeared, and it’s hard to believe that it will disappear after just a year of relatively modest price increases. If there are any negative inflation reports in the future, they could cause chaos (aka market crash ) since everyone is already acting on the belief that inflation has peaked.
The market has been in a struggle between the bears and the bulls since early February. The bears have been in charge since a false upside breakout occurred in $SPX. However, the bulls have made optimistic statements and cited oversold conditions, but the Fed and the Treasury have thrown doses of cold water on that optimism. The $SPX chart shows a lower high and lower low since the February top, and the latest rally attempt appears to be just an oversold rally. There is resistance at 4040, but the stronger resistance is between 4080 and 4200, which has already been tested once and held. Meanwhile, the broad support area from 3760 to 3850 is still in place. The $SPX chart is viewed as bearish, and a “core” bear spread is being held. However, there are some buy signals from internal indicators, including the Volatility Band buy signal and equity-only put-call ratios. The signals and indicators surrounding volatility are generally bullish at this time. The term structures have flattened out, but no sell signal has been generated from them. April $VIX futures are now the front month, and if April trades above May, that would be negative for stocks. The CBOE’s short-term, 9-day Volatility Index continues to be elevated. There is concern about inflation, and maintaining a “core” bearish position is being advised as long as the $SPX chart is in its current downtrend. A move above 4080 would alter this position.