by Mahesh Kalbhor | Mar 11, 2023 | Weekly Update
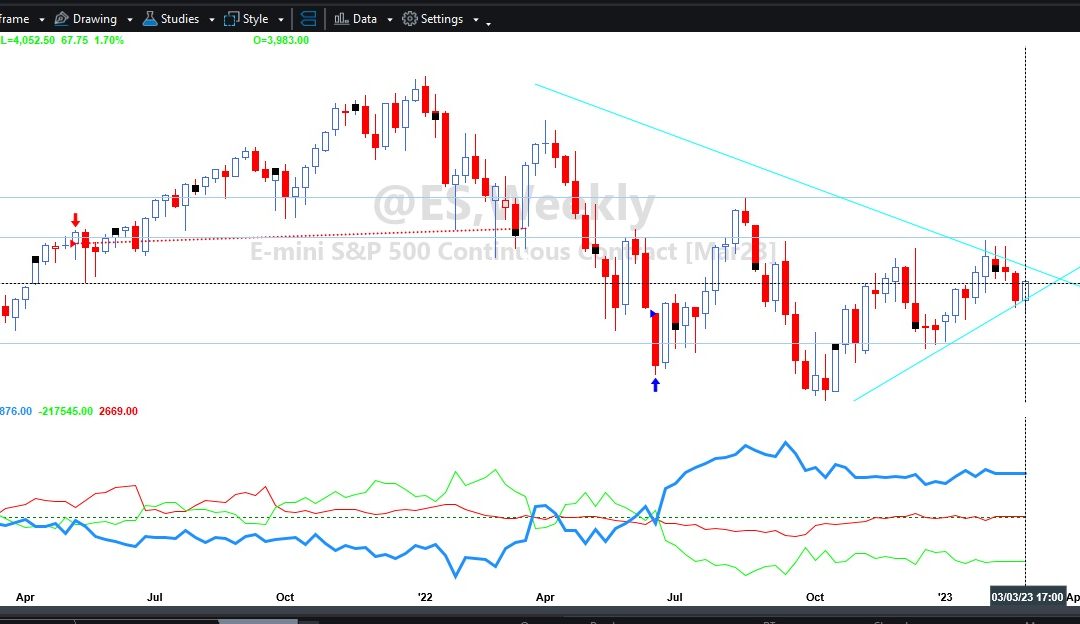
Stocks have not yet recovered from their failed upside breakout in February, which is causing a psychological burden on the market. The $SPX is currently below the apex of the blue triangle in Figure 1, suggesting that the breakout was false, as it happened so close to the triangle’s end. The resistance area that was left behind when the market retreated after the failed breakout is strong in the 4080-4200 area. The market has recently tried to rally, but it was an oversold rally and ran into resistance at the declining 20-day Moving Average, causing a sharp retreat. If the $SPX manages to rise above 4200, it will still face further resistance at 4300. On the downside, the $SPX has fallen to the support area of 3900, with the larger support area being from 3760 to 3850, left from the latter half of December. There are concerns that $SPX may break below its December lows, which is a very negative sign. Equity-only put-call ratios are on sell signals, as they continue to rise quickly. The Total put-call ratio has also risen rapidly, with readings greater than 1.00 in the last two days, indicating a very short-term, one-day buy signal. Market breadth has deteriorated badly, with both breadth oscillators on sell signals and in oversold territory, though oversold does not mean buy. The New Highs on the NYSE have recently declined, and while this does not constitute a sell signal, it could lead to one if New Lows number more than 100 for two consecutive days, and the number of New Lows exceed the number of New Highs on both of those days. $VIX jumped over three points higher on March 9th, which is an oversold condition that could lead to another “spike peak” buy signal, but stocks could still fall sharply while $VIX is in spiking mode. If $VIX closes above its previous high point of 23.63, that would cancel out the previous “spike peak” buy signal trade, and a new one would need to be set up. If $VIX closes above its 200-day Moving Average of 24.20, that would cancel out the trend of $VIX buy signal. The term structure of the $VIX futures has flattened but still slopes upward. The construct of volatility derivatives is weakening a bit, but it is generally bullish for stocks. The 9-day Vol Index ($VIX9D) has jumped higher in the past few days due to the upcoming unemployment report and the CPI report, which is volatile, resulting in a short-term (5-day) buy signal when it finally comes back down and closes below any of the other four CBOE Vol Indices. If $VIX closes above $VIX3M, it would be another oversold setup for an eventual short-term buy signal.
Tuesday’s decline was sparked by comments from Fed Chairman Powell, when testifying before Congress.
As we noted in our daily letters this week, that is quite reminiscent of the market’s reaction to then-Fed Chairman
Arthur Burns during the 1973-74 bear market. Back then it was the “3 I’s” that were bothering the market (Interest
rates, Inflation, and Impeachment). Today we have the “2 I’s” (Interest rates and Inflation), and the market is still
predominantly concerned with those. The bulls can drag out all the long-term indicators they have, but the market
is still worried about the “2 I’s.”
We are still carrying a “core” bearish position, because of the negative $SPX chart and because of the strong
sell signals from the equity-only put-call ratios. We have tried to trade other confirmed signals around that, and
current oversold conditions indicate that perhaps other short-term buy signals might be popping up soon.
Regardless, this is still a bear market until proven otherwise by $SPX price action
On Tuesday, Fed Chairman Powell’s remarks during his Congressional testimony triggered a decline in the market. This event reminded us of the market’s response to then-Fed Chairman Arthur Burns during the 1973-74 bear market, where the “3 I’s” (Interest rates, Inflation, and Impeachment) were the primary concerns. Today, the market is still predominantly worried about the “2 I’s” (Interest rates and Inflation), despite long-term indicators presented by the bulls. Our “core” bearish position remains unchanged due to the negative $SPX chart and strong sell signals from equity-only put-call ratios. However, oversold conditions suggest the possibility of other short-term buy signals emerging. Nonetheless, the market will continue to be a bear market until proven otherwise by $SPX price action.
by Mahesh Kalbhor | Mar 4, 2023 | Weekly Update

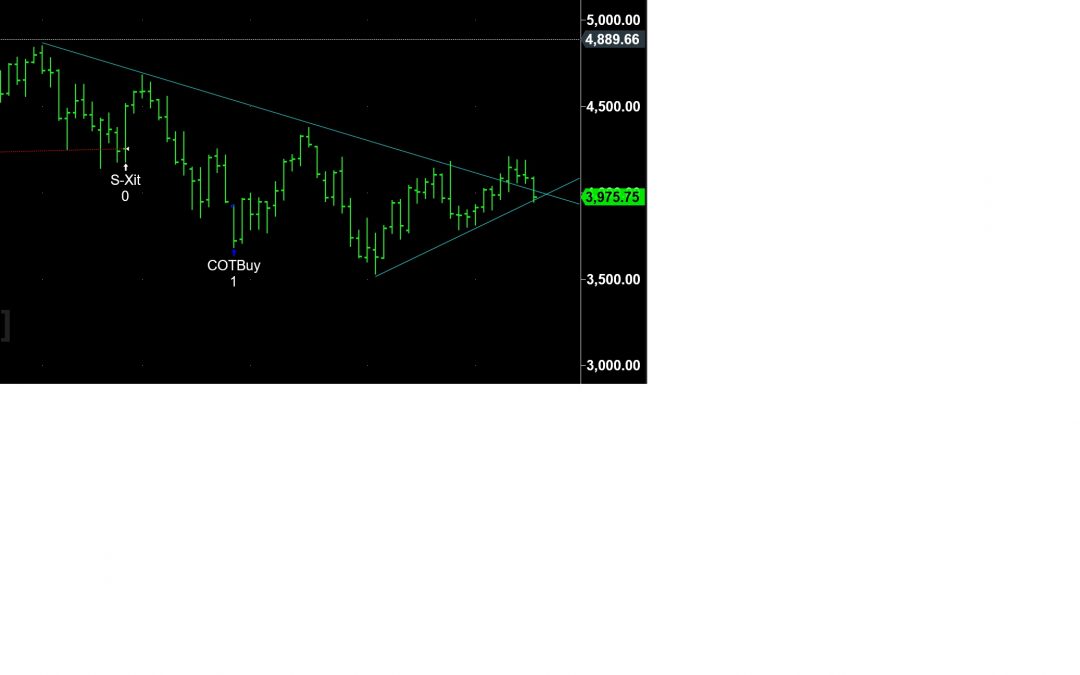
This week, prices decreased as a result of the unsuccessful upside breakout in February. Prices have fallen below the apex of the blue triangle and volatility is decreasing, particularly on a closing basis. Support is found at 3930-3940, 3900, and 3760-3860. Minor resistance is at 4020, with significant resistance at 4080-4200 and additional resistance at 4300. The modified Bollinger Bands are contracting inward due to the slowdown in volatility. The Volatility Band sell signal is still in effect since the $SPX has not yet touched the -4 Band. Equity-only put-call ratio sell signals are negative, particularly the weighted ratio. New 52-week Highs vs. New Lows on the NYSE are positive, but the NASDAQ and “stocks only” data are showing more new lows than highs std dev daily. The $VIX “spike peak” buy signal has been confirmed after five trading days, and the trend of the $VIX buy signal is still in place as long as it closes below its 200-day Moving Average. The construct of volatility derivatives is somewhat bullish for stocks. While both bulls and bears are trying to convince everyone that the market is headed their way, we are maintaining our “core” bearish position due to the false upside breakout on the $SPX chart and the sell signals from the equity-only put-call ratios but will trade other confirmed signals around that “core” position.
Trade safe ..!!
by Mahesh Kalbhor | Feb 25, 2023 | Weekly Update

The false upside breakout that was feared has now materialized, which could pose a significant problem for the market. In January, $SPX broke out above 4100, suggesting a return of the bull market, but the breakout only reached 4200 before prices started declining again. $SPX has now fallen below short-term support at 4060-4070, completing the false upside breakout scenario in my opinion. However, there is a small bullish possibility based on old-time technical analysis, which suggests that the resulting pullback may find support at the apex of the symmetrical triangle on the chart, which is around 3980. Nevertheless, the recent economic data has caused the market to drop below the apex, making this theory less reliable.
Resistance lies overhead from 4100 to 4200 and then 4300. On the downside, support exists at 3900, followed by the 3760-3850 area where $SPX traded for the last half of December. A breach of 3760 would signal the return of a full-fledged bear market. The equity-only put-call ratios are on or near sell signals, with the weighted ratio generating a confirmed sell signal due to its low level on the chart, which has led to significant market selloffs in the past. The volatility complex is weakening, with $VIX returning to spiking mode, indicating an oversold condition. Although this does not provide a buy signal, it may eventually lead to a new spike peak buy signal. The intermediate-term trend of $VIX buy signal remains in effect, which began in the middle of November last year.
In light of these developments, a core bearish position has been re-established, and while some may view the recent decline as normal February weakness, I believe that breaking key support levels and creating a false upside breakout suggests that it is more than just normal weakness.
by Mahesh Kalbhor | Feb 18, 2023 | Weekly Update
Since the beginning of the month, stocks have struggled to maintain their position above 4200, and the $SPX has slipped below the previous breakout level of 4100. There has been back and forth trading, rendering 4100 as useless as support or resistance. A close below 4070 would be the lowest since January, and a negative for stocks. Put-call option flow trigger sell signal despite two strong days this week. Although the market breadth has been oscillating, new 52-week highs on the NYSE continue to outpace new lows, which remains on a short term buy signal. The volatility complex remains subdued, which is generally positive for stocks. The $VIX is below its 200-day moving average, and the intermediate-term trend remains in place. The construct of volatility derivatives is back to a bullish state for stocks. The February $VIX futures have expired, and March is now the front month. There are no specific seasonal factors at right now, except that February is historically the worst month of the year. Overall, the market is consolidating for a new breakout in either direction.
The current year-to-date rally as a mirror image of the 2022 sell-off. While this is an important consideration, it’s essential to be cautious about extrapolating this short squeeze as the start of a new bull market. In October 2022, the narrative was that Powell would tighten financial conditions, making unprofitable tech companies, real estate, and YOLO investments sensible sectors to short. As inflation slows down, bond volatility drops, and risk parity and leveraged investors get the green light to buy stocks, this rally’s mechanical flows disproportionately affect the most shorted equity market sectors. The worst performers in 2022 are the best performers in 2023 due to the rally’s reflexive nature. However, it’s important to avoid extrapolating this into a new bull market because, once CTA, risk parity funds, and others are done covering their shorts, there will be a shortage of new marginal buyers. With risk-free rates at 5%, there is an alternative to investing in equities. Wait and watch for new bull market on the horizon as soon as fed is dovish again.
by Mahesh Kalbhor | Feb 2, 2023 | Weekly Update
The stock market has been fluctuating between minor support and resistance levels this week, creating a wider trading range. The market is awaiting a breakout in either direction. The double resistance on the upside is at 4100, where the market previously topped out twice in December. On the downside, support is in the 3760-3800 area, where the market bottomed in late December. The indicators are bullish, but the market has not been able to break out, which is a sign of caution. A breakout above 4100 and maintaining bullish indicators would signal the end of the bear market. The market is currently near the downtrend line and the 200-day Moving Average of the SPX, which both stand at around 4000. The equity-only put-call ratios, total put-call ratio, and breadth are all bullish, with buy signals in place. The NYSE new 52-week highs are also strong. The VIX has declined slightly with the SPX rally, but it appears to be reluctant to decline further and is still being bought by those who see worries ahead for the market. The next VIX expiration dates are on various dates in 2023 and 2024.