by Mahesh Kalbhor | May 2, 2022 | Weekly Update
- Failed Bear BO at 9:45 am
- Bulls tried to close at around 415
- Trading range from 11 am till 1 PM
- Bear BO at 1 PM
- 4 legs push down (H1, H2, H3, H4)
- Buy signal and Bull BO at 3 PM ( BTC – buy the close market rally ) ; Buy for any reason
- Bulls saved the day and closed GREEN
.
by Mahesh Kalbhor | Apr 18, 2022 | Earnings, Weekly Update
Market Summary
• The markets were fairly volatile last week with Wed trading up and Thursday back down. Inflation and future interest rate hikes continue to weigh on the markets. The 10-year yield continues to run higher and seems to be heading toward 3%.
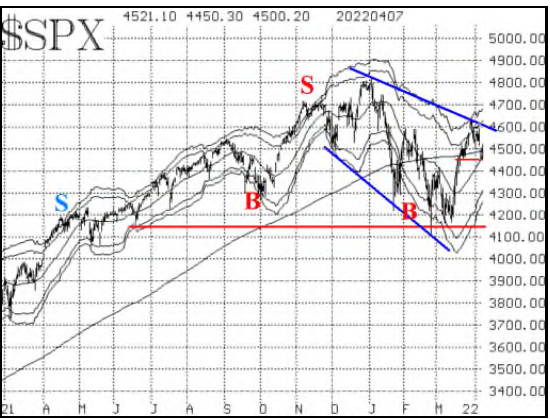
• $SPX is still locked in a trading range between Tuesday’s lows (4380) and the earlyApril highs (4637), as denoted by the horizontal purple lines on the chart. Outside of that range, there is considerable support at 4100-4200 and resistance at 4700-4800 (horizontal red lines on the chart).
• Equity-only put-call ratios continue to remain solidly on buy signals, as these ratios are dropping steadily on their charts. The buy signals that originally took place in mid-March will continue to remain in place until the ratios roll over and begin to rise.
• The QQQ and the SPY were the worst performers due to rising yields. The IWM small cap index did manage to put in a 0.55% gain on the week. Semi-conductor index (SMH) got slammed and is at a support level.
• All three of the indexes still reside below their 200-day moving averages as that level remains potential resistance if and when it is tested. A non-bullish outlook still looks warranted.
• The CBOE Volatility Index (VIX) has drifted back down to its 200-day moving average. Is a rally off that moving average imminent, or will it reside around or below it as it did a couple of weeks ago? A VIX rally would most likely mean a further drop for stocks.
• The construct of volatility derivatives is solidly bullish in its outlook for stocks. The term structure of the $VIX futures slopes upward all the way out through October, so that is a positive for the stock market, as is the fact that those futures are trading at a premium to $VIX. In addition, the situation is helped by the fact that the CBOE Volatility Indices term structure slopes upward, also.
• In summary, there are mixed indicators in place, which is not unusual when $SPX is swinging back and forth in a (wide) trading range. Both bulls and bears have been frustrated by the lack of follow-through.
• It certainly appeared that the bears had a chance this week when $SPX closed below 4420, but as has so often been the case, no further decline occurred. The bulls experienced the same sense of futility when the breakout above 4600 a couple of weeks ago was not able to extend higher. So, we will continue to trade individual indicator signals as they occur, without being overly committed to either the bull or bear case right now
What’s happening this Week:
• Russia-Ukraine situation.
• Some housing sector stats Monday and Tuesday
• Quarterly earnings will accelerate for the next several weeks going forward with NFLX and TSLA a couple of the big-name stocks expected to release numbers this week. Remember to check for the expected earnings announcement before entering any trade. Surprises can cost you money. In addition, there are several economic reports due this week including several housing numbers that could give further insight to how inflation is affecting the economy. Hope you enjoyed the long weekend and have a safe, happy and prosperous week ahead!
Economic calendar
Apr 19: Housing Starts
Apr 20: Existing Home Sales
Apr 20: Beige Book
Apr 21: Jobless Claims
Apr 21: Economic Indicators
Sectors in Play
• Consumer staples for safety trade
• Energy (oil, nat gas, coal and uranium) still looks good as well as gold and silver.
• Materials, metals and mining had a good week (XME)
• Technology and consumer discretionary weakest sectors on inflation, rising rates and potential for an economic slowdown.
Earnings:
Earnings on deck for this week:
• Mon 4/18 – BAC, SCHW bmo – JBHT amc
• Tues 4/19 – HAL, JNJ bmo – NFLX, IBM amc
• Wed 4/20 – PG, ABT bmo – TSLA, UAL, CSX amc
• Thur 4/21 – AT&T, SNAP, AA
• Fri 4/22 – Verizon, SAP

Watchlist :
CAT – monster day on Friday…metals and mining sector strong.
SMH – at support and could bounce here but will be challenged if 10 year yield keeps rising.
TSLA – Reports Wed – watch $950 and $1100 for support and resistance levels.
USO – still looking strong – see XLE comment
XLE – looks ready to break higher again
XLV – the pullback here – still considering a potential for an entry at the 20 sma daily ($138 level).
AMD – With the stock dropping below some major support last week, it may be poised to drop lower. Potential bear put spreads will be modeled out with a bearish start to the week.
MARA – The stock is setting up a potential GKO, which means it may be moving even further to the downside. Straight puts will be considered.
GLD – The ETF may be on the move higher if inflation worries keep growing. Potential bull call spreads will be explored with a move over a pivot level at $185.

by Mahesh Kalbhor | Apr 8, 2022 | Trade Idea, Weekly Update
SPX Chart Analysis
• A move above 4637 (last week’s highs) would justify a bullish stance, while a move below 4420 would justify a bearish stance. Beyond those levels, there is further resistance in the area of the all-time highs, at 4700-4800.
• On the downside, there is strong support near where the market probed in late February and early March: the 4100-4200 level.
Put-Call Ratio Analysis

• Our most bullish indicators remain the equity-only put-call ratios, which are still on strong buy signals. They peaked from extremely high (oversold) levels in mid-March and are in the process of declining rapidly now. The slight wiggle on the standard chart (Figure 2) is meaningless, according to our analysis programs; it remains on a buy signal
VIX Analysis

• There are mixed signals from the volatility indicators.
• A brand new $VIX “spike peak” buy signal was generated at the close on April 7th. It will remain in effect for 22 trading days, unless stopped out by $VIX moving above the highest price that it had reached at the recent peak (24.78). So that is a bullish sign.
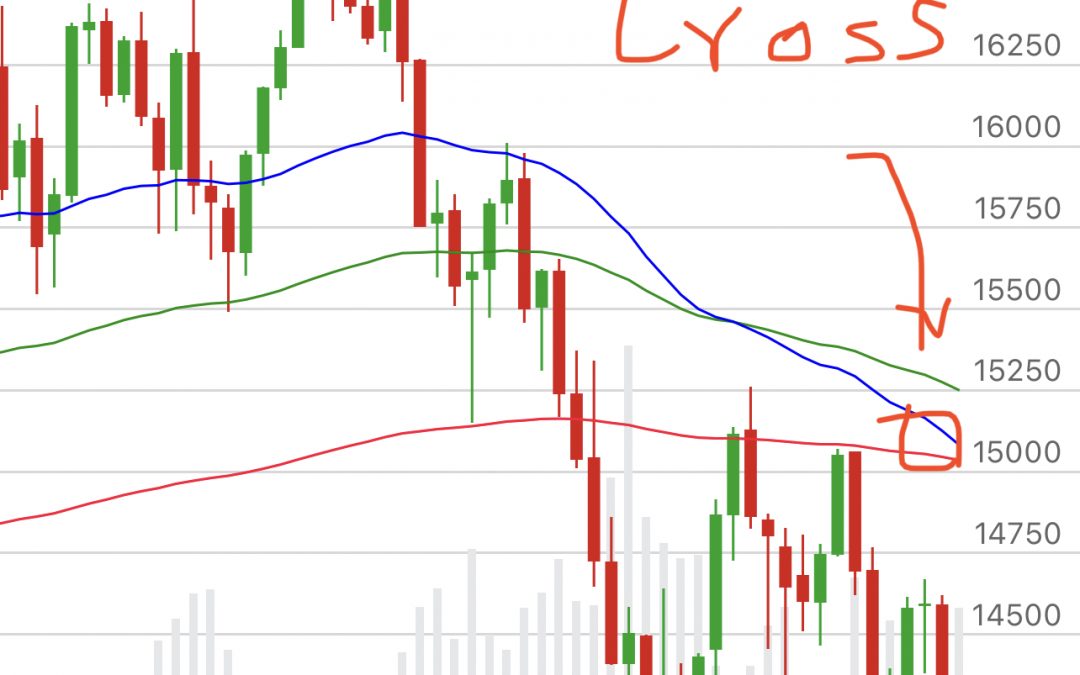
• Contrasting that, though, is the fact that $VIX has once again moved above its 200-day moving average. That means that both $VIX and its 20-day MA are above the 200-day, and that is an intermediate-term sell signal. The last time this occurred was in mid-January (purple circle in Figure 4), and the stock market sold off from there.
• The construct of volatility derivatives remains bullish for stocks, as the $VIX futures are trading at a premium to $VIX, and the term structure slopes upward. The CBOE Volatility Index term structure also slopes upward.
Summary
• In a nutshell the SPX is somewhat range-bound, looking for a breakout above 4637 or a breakdown below 4420 as an area to add bullish or bearish positions, respectively.
• It is a short week for traders and investors as the market will be closed on the 15th in observance of Good Friday.
• Keep in mind that generally IV levels are lower during short weeks of trading.
• It seems like the bulk of quarterly earnings just ended and here we are again starting another round. Most earnings announcements will come later, but several • financial institutions are expected to announce later in the week.
• In addition, a few economic reports are due to be released, even on Friday. Have a great week and a Happy Easter, and enjoy some time off
Trade Ideas:
○ $VIX “Spike Peak” Buy Signal
§ As of the close of trading on April 7th, a new $VIX “spike peak” buy signal has been confirmed.
§ Buy 2 SPY May (6th) at the money calls And
§ Sell 2 SPY May (6th) calls with a striking price 15 points higher.
§ This buy signal will remain in effect for 22 trading days. Also, it would be stopped out if VIX subsequently closes above 24.78 – the highest peak price that generated the above sig
Earnings this week
—Wed 4/13 – JPM, Delta, BlackRock
–-Thu 4/14 – Wells Fargo Bank , Citi Bank , Morgan Stanly (MS) and Goldman Sachs (GS)

Economic Calendar
Apr 11: Consumer Price Index
Apr 11: Federal Budget
Apr 13: Producer Price Index
Apr 14: Jobless Claims
Apr 14: Retail Sales
Apr 14: Import Price Index
Apr 14: Business Inventories
Apr 15: Industrial Production

by Mahesh Kalbhor | Mar 8, 2022 | Weekly Update
3/7/2022 – Todays market action summary-
– Crude oil topped $130 (all time high after 14 years) ; SPX down 3% ; if oil prices continues to rise it will slow down US economy and we might enter into recession (but too early for recession )
– Gold hit $2000 /oz ; GLD $184
– DOW enters into correction 10%
– QQQ down 20% ; officially enters into bear 🐻 market territory
– Next support for SPX is 4000 level
SPX chart Analysis

• The chart of $SPX is bearish, with lower highs and lower lows.
• 20 day MA is currently at 4410.
• The 200-day MA is now rolling over and is at 4460.
• It would take a clear breakout over the resistance at 4600 in order to SPX to be bullish again.
• It seems that each time $SPX sells off into that area, the accompanying indicators have already become oversold, and a bounce occurs. This is all part of the difficulty of navigating a bear market, even if one is bearish. The oversold rallies look good for a brief while, causing shorts to cover and encouraging bulls, but then they fail again. That is the pattern that we are in as long as $SPX remains below 4600.
Equity-only put-call ratios remain on buy signals

VIX

• The latest $VIX “spike peak” buy signal of February 24th remains in place, and it would be stopped out if $VIX were to close above 37.79 (its most recent peak high). But overall, implied volatility is giving us a more negative picture than it has in a long time.
• First, the trend of $VIX remains strongly higher, as both $VIX and its 20-day Moving Average are accelerating upward, above and away from the 200-day MA (which is now at 20 and rising). That is bearish for stocks. More importantly negative, though, is the fact that the term structure is inverted and has been, for the most part, since February 17th.
• The front month $VIX March futures continue to trade at a price that is above the $VIX April futures. That alone is a big negative. Furthermore, the term structure of the $VIX futures slopes downward through the first four months and is flat after that (see boxes below). In addition, this week for the first time since the pandemic trading of March 2020, the term structure of the CBOE Volatility Futures was completely inverted. That is, $VIX9D > $VIX > $VIX3M > $VIX6M > $VIX1Y. That is a setup for a “$VIX crossover” buy signal, when $VIX subsequently closes back below $VIX3M. That crossover took place on March 2nd, but only by a few cents and seems to have a good chance of reversing back today. This “$VIX crossover” buy signal is usually a short-term (5-day) signal. So, the bigger picture here is the negativity of the construct of $VIX derivatives.
Updates from last week :
• Markets were all down on last week due to ongoing conflict which is a terrible situation. The conflict is also driving a steep rise in commodity prices on fuel, metals and food which is having a far reaching affect. Inflation was already a concern due to supply chain constraints.
• Fed is stuck because the rising costs are not the result of wage pressures or an overheated economy.
• Money has rotated coming out of some parts of the market and going into other areas ( GOLD and Oil – on fire – VERY BULLISH )
What happening this week:
• Continue to watch the 2 year and 10 year treasury yield for a close in the gap between the two.
• Russia-Ukraine War situation.
• Earning season winding down.
Sectors in Play
On fire – Energy, Rails, Fertilizer companies, Materials like aluminum, iron and copper.
• USO and oil sector XLE and GUSH.
• GDX or NUGT – gold.
• CF, SEED and MOS – fertilizers.
• CSX – rails.
• X, FCX, NUE, AA – materials.
High PE technology and consumer discretionary under pressure and dropping.
• XLY
Earnings:
Earnings on deck for remainder of this week:
• Mon – nothing of note
• Tues DKS, WOOF bmo and BMBL amc
• Wed ZIM, OTLY bmo
Watchlist:
AAPL – $170 resistance for possible call selling.
AMZN – $3200 resistance for possible call selling.
PYPL – lost $100, $95 is now support.
ROKU – $140 is resistance for possible call selling.
SQ – support is back at $100 now after bounce back.
TSLA – $950 still major resistance.

by Mahesh Kalbhor | Feb 28, 2022 | Weekly Update
• The 55-day rule – there hasn’t been a top that lasted for 55 days without the market imploding (in 2020, the market dropped almost immediately after the top was formed, but that was due to the pandemic of course).
• Most people don’t realize that the Crash of 1929 and the Crash of 1987 both occurred exactly 55 calendar days after the stock market had topped. All prices in this article are closing prices on the day being referenced. 1929: the peak in the Dow was reached on September 3rd, when it closed at 381.17. 55 calendar days after September 3rd was (Monday) October 28th. That was the exact date of the Crash of 1929, with the Dow down 40.58 points, or 13.5%. 1987: the Dow topped out at 2722.42 on August 25th. 55 calendar days later was (Monday) October 19th when the Dow collapsed 507.99 points, or 22.6% in one day! This year, the Dow topped out on January 4th, and 55 days later is Monday (!) February 28th.
• In both 1929 and 1987, there was a sharp market decline in the week preceding the Crash (especially on the Friday before), so that is something else to watch for. These Crashes just didn’t appear out of thin air. Fibonacci fans like the fact that 55 is a Fibonacci number. There is probably something there with biometrics, too (remember that?). Of course, there is no real explanation, except for the fact that in both cases, 55 days of not seeing stocks go up was about all people could take. In both cases, most stocks had already started downward, just as they have over the last eight months.
• Other “crashes” don’t line up so neatly. The Flash Crash of 2010 and the “Tech Stock Massacre” of April 14, 2000, both occurred far closer than 55 days to the previous market top. In recent years, there have been only a few times where a market top has lasted for more than 55 days. Usually, by then, the market has recovered and is merrily on its way to new highs. However, in 2013 and in 2016, the 55-day Rule was “in play,” but did not produce a crash. The sharp market selloff of August 2015 was “related” to the 55-day time period but did not line up exactly.
• For whatever it’s worth, the 55-day period has proven to be problematic in a big way two times in the past. To ignore the possibility of a third occurrence could be detrimental to your net worth. So, if you want to trade this, always Buy 10 SPY puts 10% out of the money when the market is at its peak.
by Mahesh Kalbhor | Feb 20, 2022 | Weekly Update
The Nasdaq Composite index may be in for trouble, but then again it may not.
The index has formed a “death cross” chart pattern, meaning its 50-day moving average has dropped below its 200-day moving average.
That can be a sign of trouble ahead for stocks. For example, the pattern arose in June 2000, soon after the stock-market plunge began, and it emerged in January 2008, before the financial crisis, Bloomberg reports.
But the death cross also can be a lagging indicator. It showed up in April 2020, after the Nasdaq hit its trough the previous month.
The Nasdaq already has slid 16% from its Nov. 19 closing high.
Since 1971, the index has hit a death cross 31 times, and in 77% of those cases, the index was higher six months afterward, according to Potomac Fund Management, as cited by Bloomberg.